- HOME
- Work culture
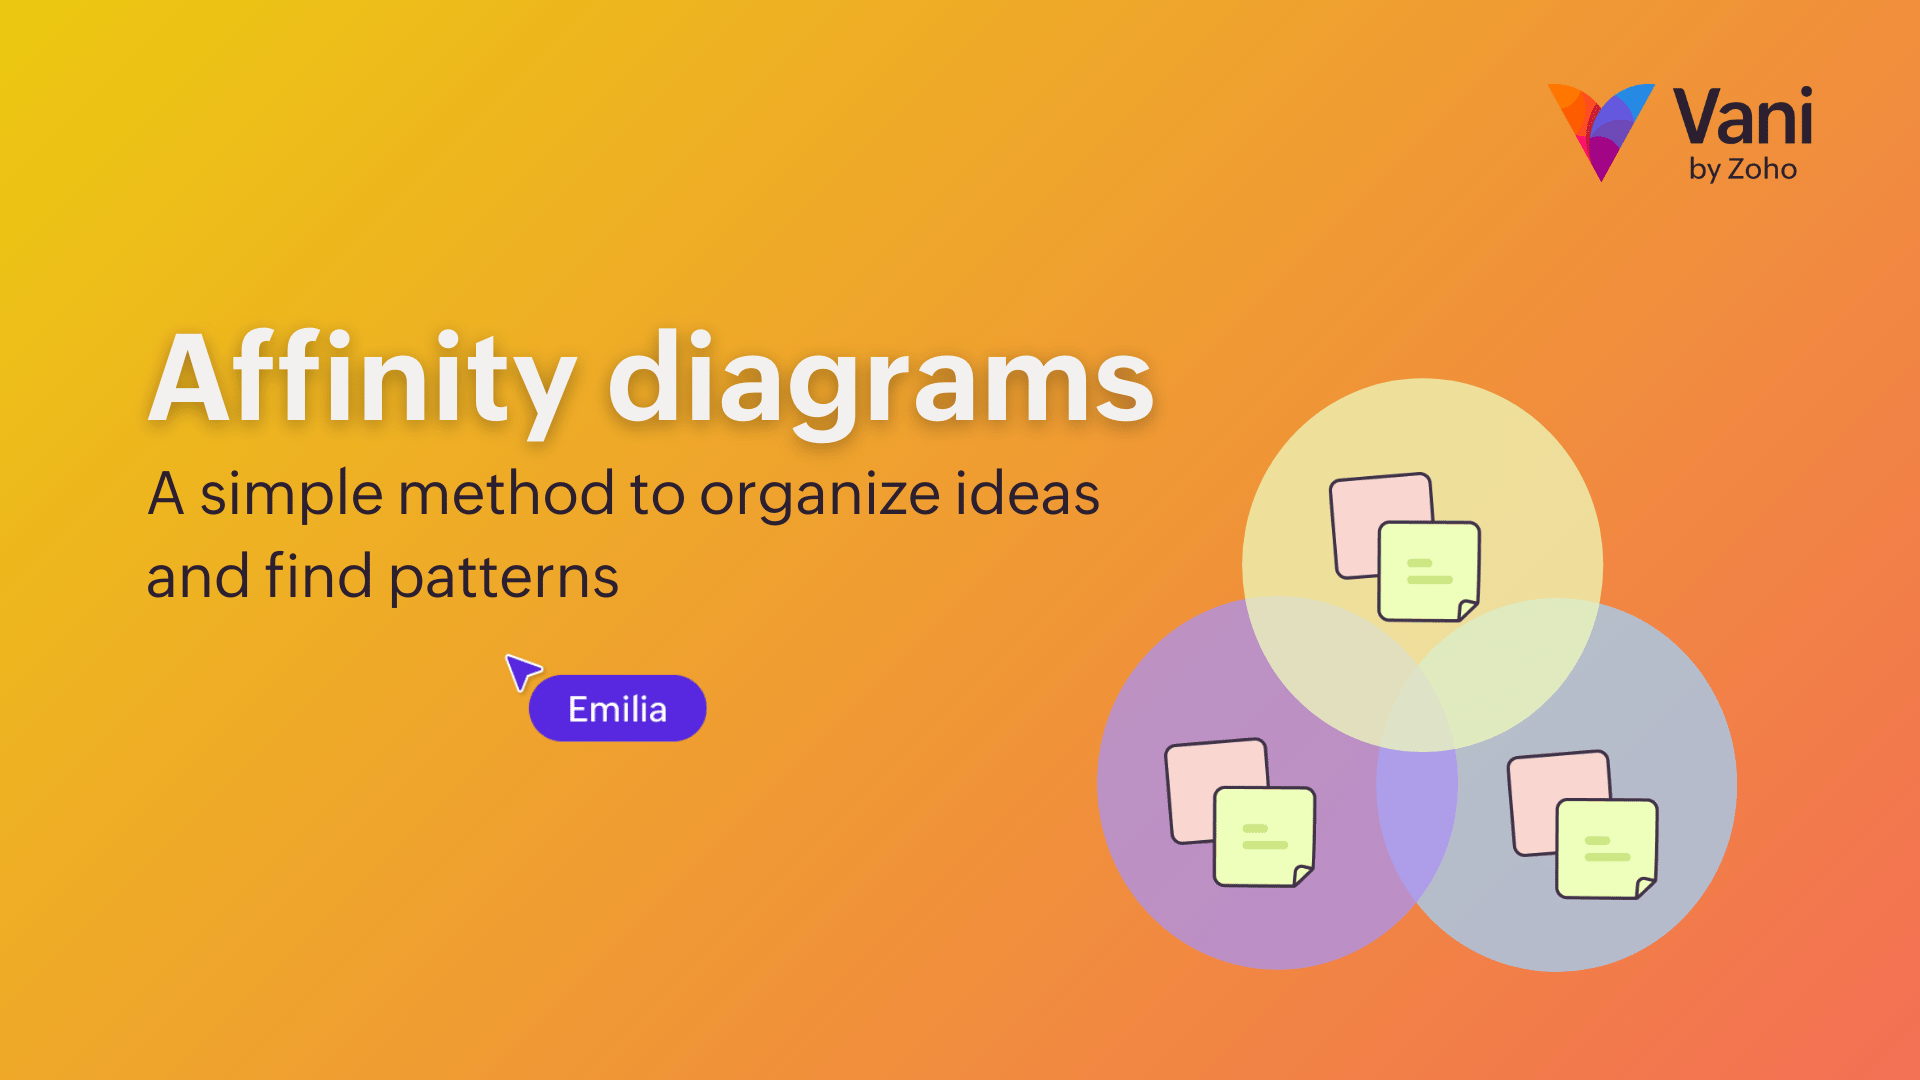
- Affinity diagrams: A simple method to organize ideas and find patterns
Affinity diagrams: A simple method to organize ideas and find patterns
- Last Updated : January 12, 2026
- 269 Views
- 4 Min Read
Imagine you’re a mail carrier weaving your way through Seattle—Downtown, Capitol Hill, Ballard, Pioneer Square. You start your day with a bag full of parcels and a rough idea of where each one needs to go. First stop: Downtown. Then Ballard. Next, Pioneer Square. So far, so good.
But here’s where things get tricky. You suddenly realize the last two packages require you to circle back to Downtown and then head all the way over to Capitol Hill. Before you know it, you’re zig-zagging across the city, wasting time, energy, and fuel—simply because the deliveries weren’t grouped by location.
If only you had seen the pattern earlier, you would have had the parcels sorted into meaningful groups before you hit the road.
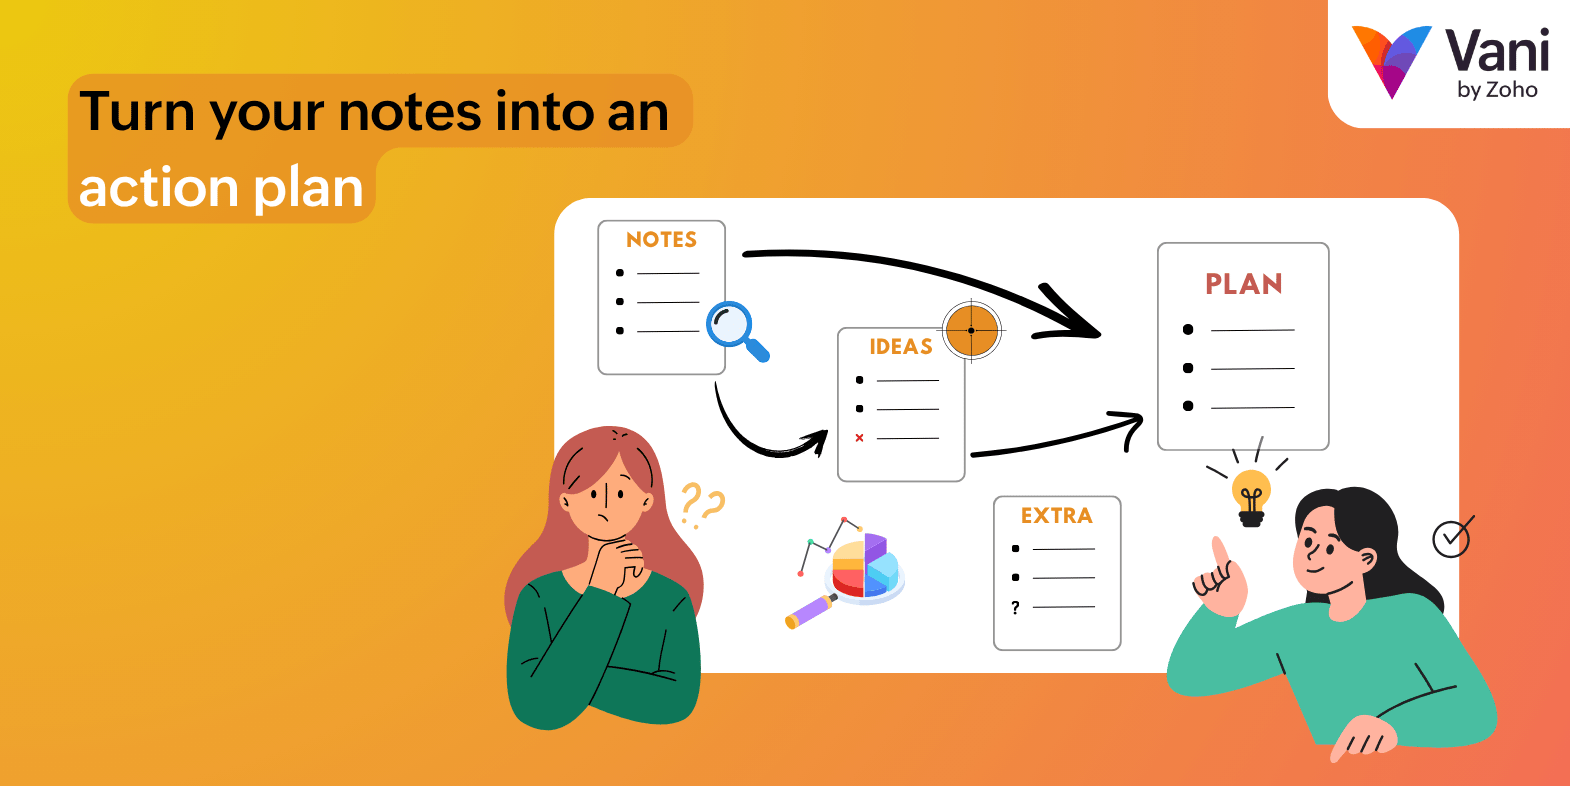
That’s exactly what an affinity diagram helps you avoid—except instead of parcels, you’re sorting ideas.
This article will walk you through everything you need to know about affinity diagrams: what they are, when to use them, who benefits from them, and how to create one easily with Vani. Let’s dive in.
What is an affinity diagram?
Think back to the last time you had way too many ideas floating around—maybe a team brainstorm where everyone kept shouting suggestions or a research session that ended with pages of notes and dozens of insights.
At first, all that information feels exciting, but after a while, it becomes overwhelming. That's where an affinity diagram steps in as a visual organizer to sort your ideas from a brainstorming session into different groups or categories based on the relationship between them.
Write each idea on a sticky note, spread them out, and then start grouping the notes that feel like they belong together.
Suddenly, the chaos starts forming patterns—and because Vani gives you an infinite canvas, you can spread out hundreds of sticky notes without worrying about running out of space.
When should you use an affinity diagram?
The magic of an affinity diagram shows up in moments of too much: too many ideas, too many insights, too much feedback, and too many directions.
Here’s when the method works best.
Brainstorming sessions
By creating an affinity diagram, you take all the creative chaos of brainstorming and give it a structure. Group notes based on similarity; maybe ideas about user onboarding cluster together, marketing ideas form their own section, and technical improvements create another. Within minutes, the whole board starts to make sense, and you're not just brainstorming anymore—you're shaping a direction.
Synthesizing research
If you’ve ever done UX or product research, you know the feeling of drowning in details: interview transcripts, observation notes, customer quotes, and survey responses.
With an affinity diagram, you can group insights into themes such as:
Users struggle with navigation
Users want more customization
Users avoid certain features due to confusion
Suddenly, the patterns stand out, and the complexity turns into clarity.
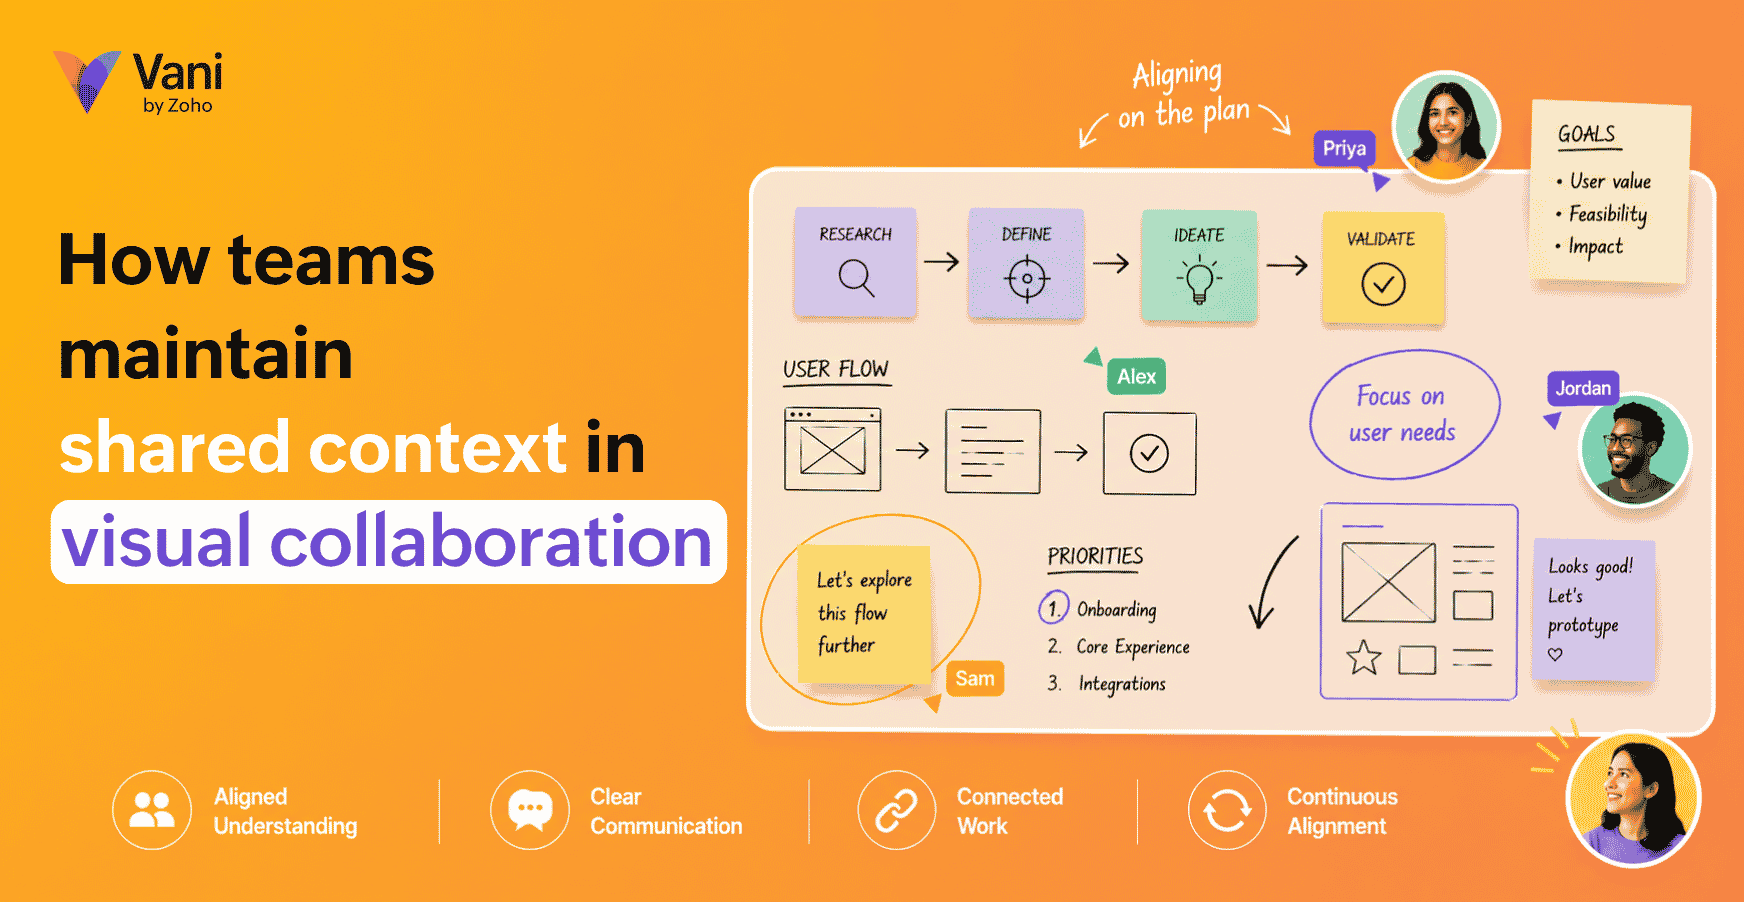
Aligning a team
When team members collaboratively group ideas into themes, everyone literally sees the same picture forming in front of them. It’s much easier to align when the information is visually organized rather than sitting in a document or a verbal explanation.
Analyzing qualitative data
Feedback from customers, survey comments, and support tickets—they rarely arrive neatly labeled or categorized. Instead of reading everything one by one, an affinity diagram helps you turn that chaos into insight by grouping similar feedback so you can find repeated issues, recurring requests, and unspoken patterns.
Identifying the root causes
When you’re trying to diagnose a problem with a model like the 5 Whys or Fishbone diagram, the affinity diagram helps categorize the potential causes and makes it easier to identify the patterns.
How to create an affinity diagram in Vani
Everything you need to create an affinity diagram is already in Vani: an infinite canvas, sticky notes, templates, annotations, and real-time collaboration.
Here’s a more detailed look at how the process unfolds on Vani:
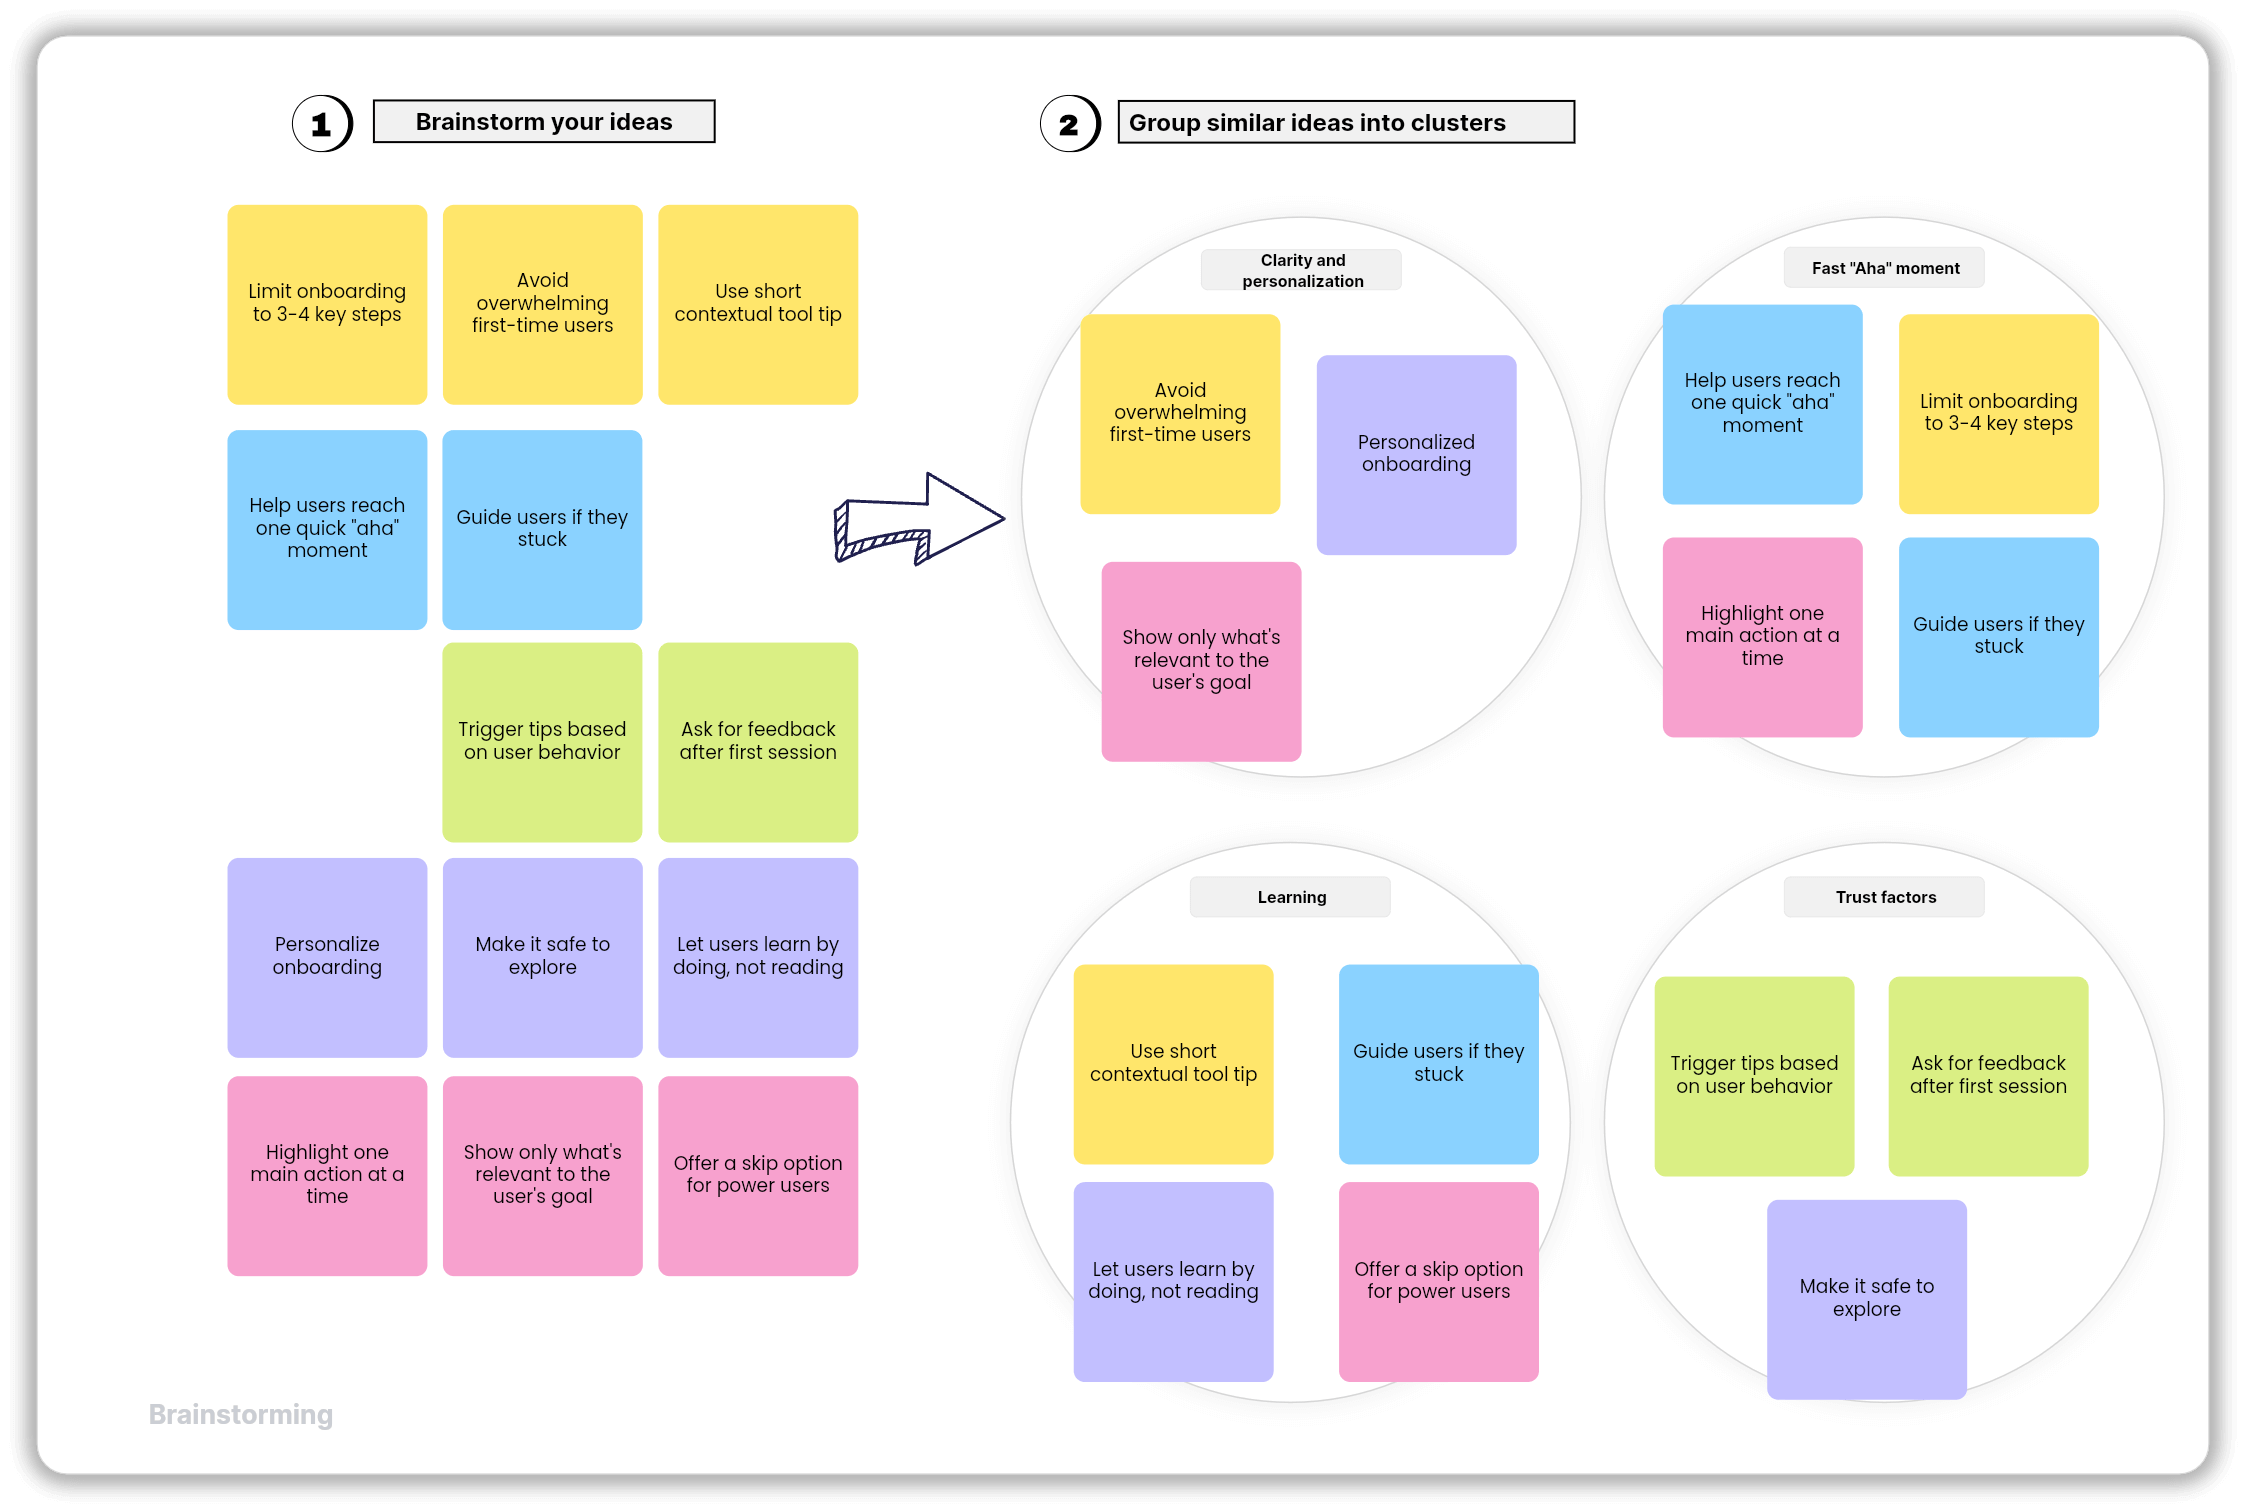
Step 1: Gather all your ideas or data
Before creating an affinity diagram, bring everyone involved in the project together on an infinite canvas and brainstorm ideas for new product development, features, campaigns, or project plans.
Step 2: Spread everything out
Ask your Spacemates to jot down ideas on separate sticky notes with one idea per note. If you want a head start, Vani has a ready-made affinity diagram template. Just drag it from the templates menu and add it to your canvas directly.
Step 3: Organize your ideas
With all the ideas stacked on the canvas, you can now start grouping the sticky notes based on themes, similarities, or related concepts. Continue grouping them until all sticky notes are organized into clusters.
Step 4: Name each group
Label each cluster with descriptive names that capture the essence of its ideas. Review these with your team for any refinements. Make any necessary changes to ensure the ideas match your project goals or objectives.
Who can use this affinity diagram?
The affinity diagram isn't limited to any specific profession; it's widely used by people who deal with lots of ideas, inputs, data, and qualitative information. Here are some common main groups that benefit from using this affinity diagram.
Product teams: PMs, engineers, and UX designers use them to synthesize research, identify user needs, prioritize features, and plan roadmaps—all on one single infinite canvas in Vani.
Marketing & creative teams: Marketers, writers, and designers can group campaign ideas, audience insights, messaging themes, and creative directions. By grouping this, it helps them to plan effectively and execute the campaign.
Researchers: Whether qualitative or quantitative, researchers can cluster interview responses, behavior patterns, or insights into digestible categories.
Operations, CX, and quality teams: The operations team uses affinity diagrams to organize process issues, quality concerns, production data, and improvements.
Students: For assignments, group projects, research findings, or study notes, affinity diagrams help students organize and make sense of complex topics.
Conclusion
Affinity diagrams may look simple, but they’re extremely helpful. They turn messy walls of notes, scattered thoughts, and overwhelming data into structured clarity. They help teams align, reveal hidden patterns, and move confidently from idea to insight. Whether you're analyzing user research or brainstorming ideas, this method is a timeless tool for creative problem-solving.
Try building your next affinity diagram in Vani—you might be surprised how quickly clarity emerges once your ideas find their true clusters.