Visualize and collaborate on data flow diagrams in Vani
Vani's DFD Kit helps teams visualize how data moves through a system, map processes clearly, and collaborate on workflows together on a shared visual canvas.
What is a data flow diagram?
A data flow diagram (DFD) shows how information moves through a system. It maps how data enters, gets processed, is stored, and flows between different parts of a system.
DFDs use simple elements like external entities, processes, data stores, and data flows to make complex systems easier to understand.
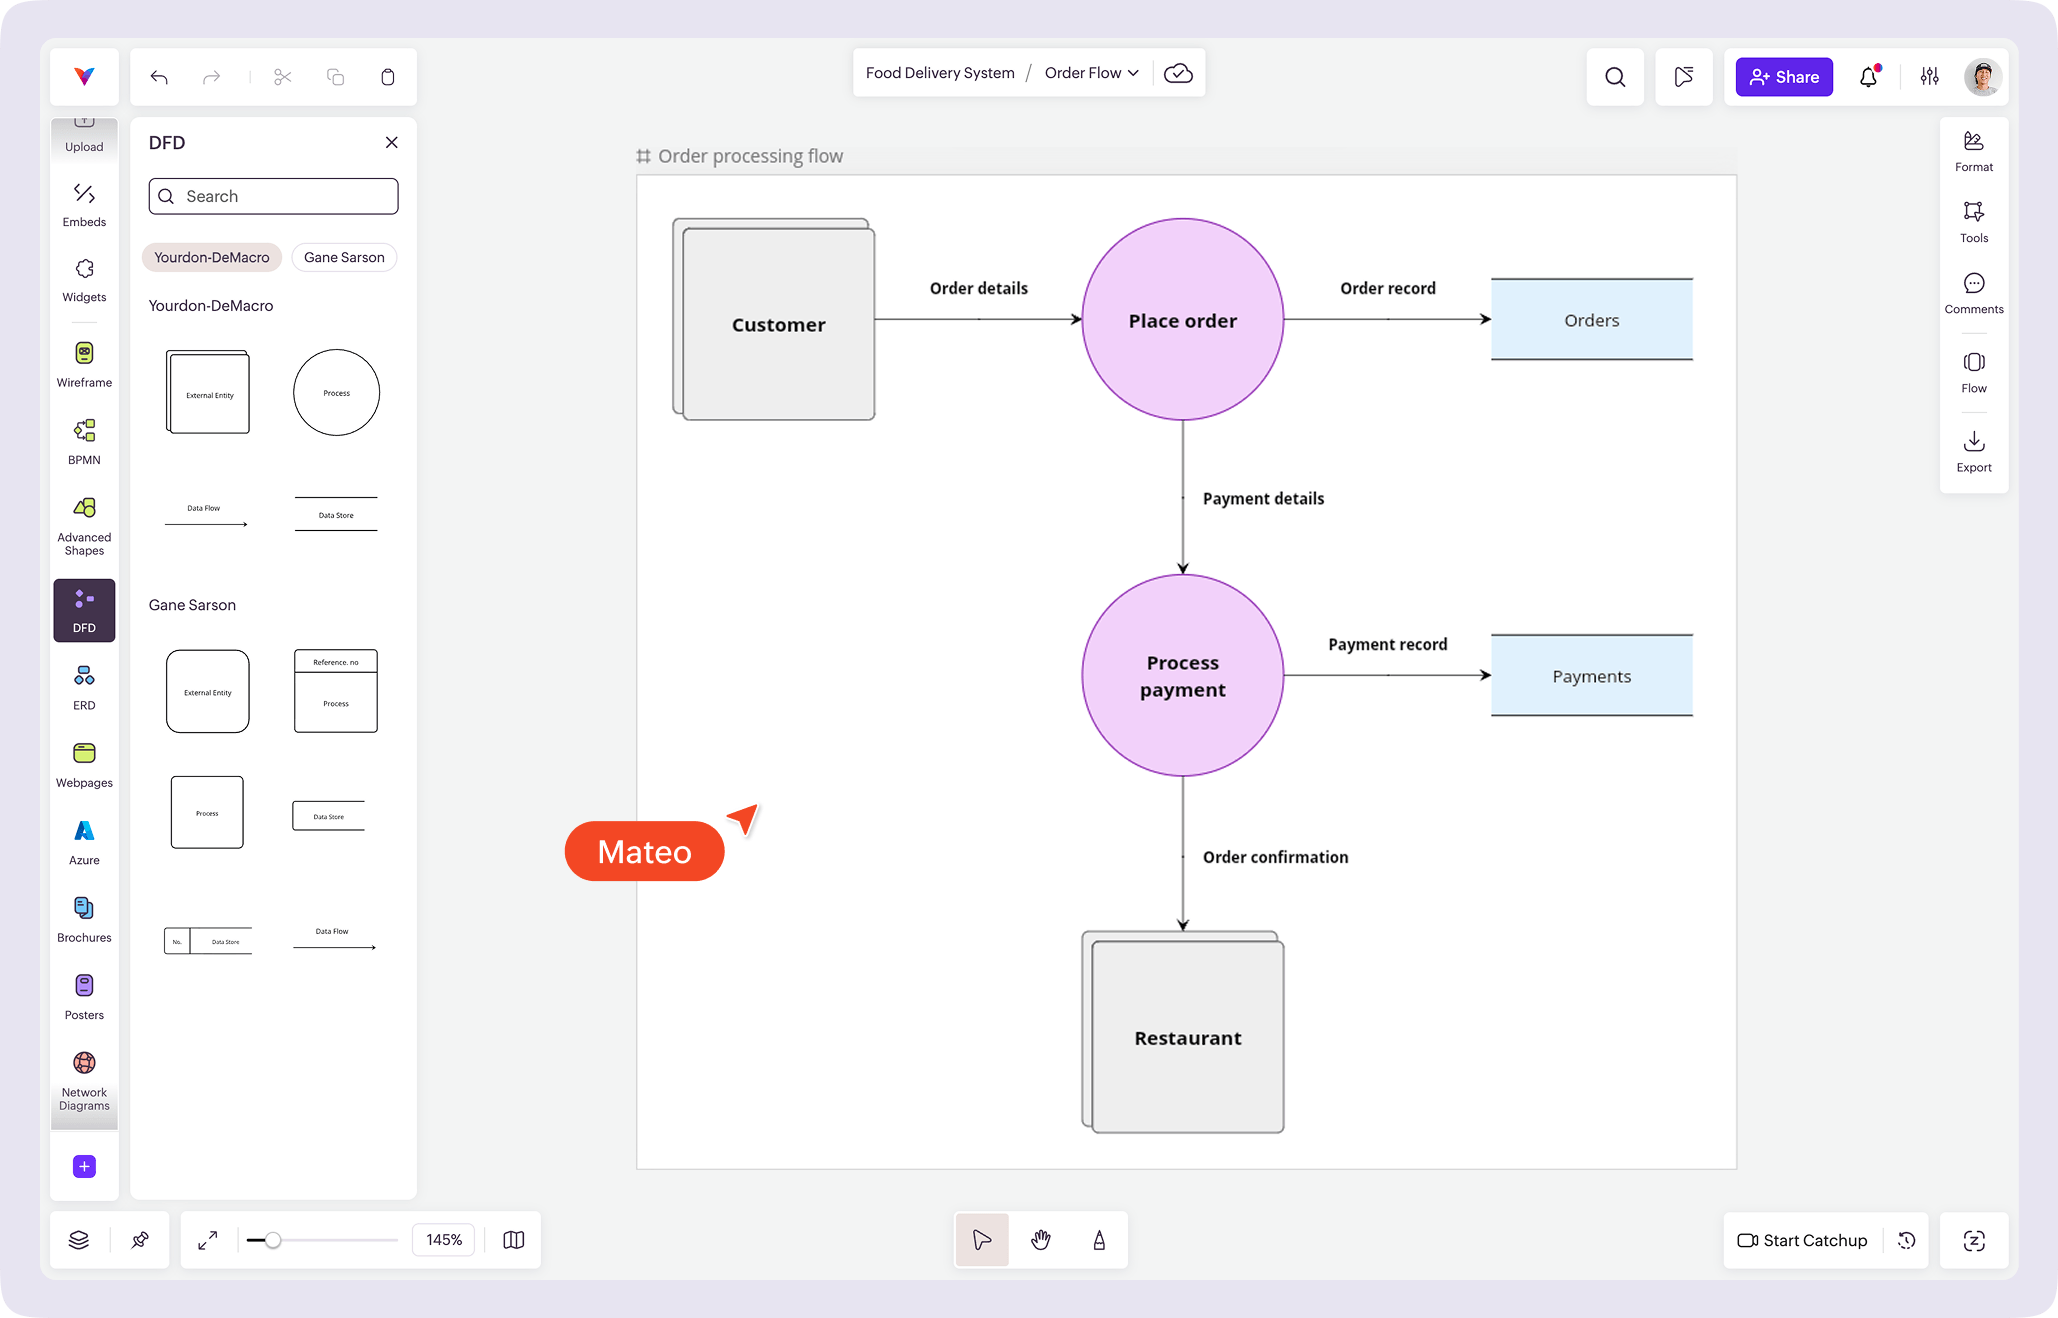
Example: Imagine a person placing an order in a food delivery app. The order details move from the user to the system, then get processed, stored in the database, and sent to the restaurant. A data flow diagram shows this entire flow step by step, making it easier to understand how information moves through the system.
Data flow diagrams are commonly used in:
- Understanding system workflows
- Planning back-end and business processes
- Mapping product features and logic
- Adding documentation and onboarding
- Incorporating learning and system analysis
Why use Vani for data flow diagramming?
With Vani, teams can create data flow diagrams that clearly show how information flows through a system.
Make system flows easy to understand
Use simple shapes for processes, data stores, and external entities to break down how your system works. Even complex flows become easier to follow when everything is mapped visually.
Visualize data movement clearly
Show how data moves between different parts of your system using connectors and labels. This makes it easier to follow what happens at each step, even in more complex workflows.
Collaborate while mapping processes
Work on data flow diagrams together in real time. Leave comments, start a video Catchup, review flows, and refine the process with your team without losing context.
What's included in the DFD Kit
The DFD Kit provides the core elements needed to create clear and structured data flow diagrams:
- External entity shapes
- Process shapes
- Data store symbols
- Data flow connectors
- Support for standard DFD notations (Yourdon-DeMarco and Gane-Sarson)
- Connector text for labeling data flows
- Styling options for clear documentation
This helps teams map, review, and communicate system flows visually.
How to create a data flow diagram in Vani
-
Start a new Space in Vani.
-
Add the DFD Kit from the marketplace to your toolbar.
-
Open the DFD Kit in the toolbar to access shapes.
-
Drag and drop external entities, processes, and data stores onto your Space.
-
Use connectors to show how data flows between components and label flows where needed.
-
Invite teammates to review the diagram, start a video Catchup, and refine the process together.
-
Export your diagram or share it with your team for documentation and ongoing reference.