- HOME
- Work culture
- Fishbone diagram for root cause analysis: A complete practical guide
Fishbone diagram for root cause analysis: A complete practical guide
- Last Updated : April 2, 2026
- 162 Views
- 11 Min Read
When a problem appears in a process, product, or system, most teams instinctively try to fix what's visible. A missed deadline is handled by pushing the team to work faster. A quality issue is addressed by rework. A customer complaint is resolved with an apology or a one-time correction. While these actions may reduce the immediate impact, they often fail to solve the real issue.
That is why the same problems keep coming back.
In many cases, recurring issues are not caused by a lack of effort—they're caused by a lack of clarity. Teams respond to symptoms without fully understanding what's creating them. As a result, they spend time and resources fixing the surface while the underlying cause remains untouched.
This is where root cause analysis becomes essential.
Root cause analysis is the process of identifying the fundamental reason a problem happened so that it can be corrected. Instead of asking, “How do we handle this issue right now?” it asks, “Why did this happen in the first place?” Among the many tools used for root cause analysis, the fishbone diagram remains one of the most practical and effective.
A fishbone diagram helps teams break down a problem, explore all likely causes, organize those causes into clear categories, and move toward evidence-based solutions. It's simple enough for any team to use but structured enough to support serious problem-solving.
In this blog post, let's explore what a fishbone diagram is, why it's useful for root cause analysis, when to use it, how the 6M model works, and how to create a fishbone diagram step by step in a way that leads to real improvement.
What is a fishbone diagram?
A fishbone diagram is a visual tool used to identify, organize, and analyze the possible causes of a specific problem. It's also known as an Ishikawa diagram or a cause-and-effect diagram.
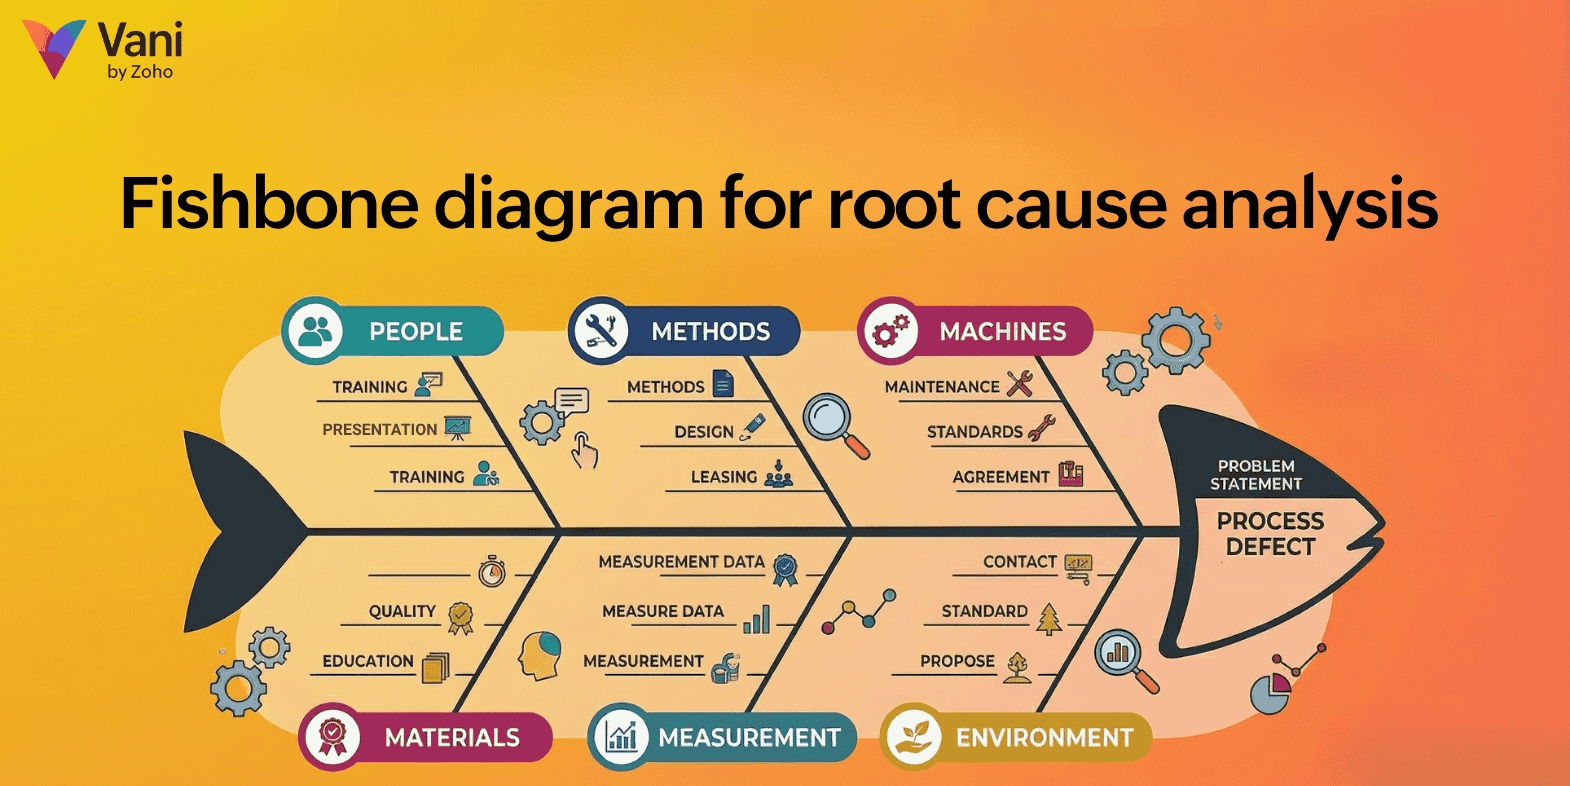
The name comes from the way the diagram is drawn. The main horizontal line looks like the spine of a fish. At the end of that line is the problem statement, which forms the head. From the spine, angled branches extend outward to represent major categories of possible causes. Smaller branches are then added to list detailed contributing factors under each category.
This structure may look simple, but it's powerful because it forces teams to think in an organized way. Instead of discussing a problem randomly or blaming the first visible issue, the fishbone diagram encourages teams to examine the problem from multiple angles.
For example, if a team is dealing with repeated delays in project delivery, the issue may not be caused by only one factor. The delay could be linked to poor planning, unclear ownership, inefficient workflows, incomplete briefs, weak tools, or reporting gaps. A fishbone diagram makes it easier to map all of these possibilities in one place, see how they relate to each other, and identify which causes matter most.
That's why the fishbone diagram is so useful in root cause analysis: it turns scattered discussion into structured investigation.
Why use a fishbone diagram for root cause analysis?
Many problems persist longer than they should because teams focus on visible symptoms instead of identifying the underlying causes. A fishbone diagram helps shift this approach by introducing structure, clarity, and depth into the analysis process, making it easier to understand not just what's happening but why it's happening.
It brings structure to problem-solving
In many organizations, problem-solving discussions tend to become scattered. Different people highlight different issues such as workload, tools, or communication, but without a clear framework, these discussions often lack direction and remain opinion-driven.
A fishbone diagram provides that structure by organizing possible causes into defined categories. This allows teams to examine each area systematically instead of trying to address everything at once. As a result, the discussion becomes more focused, logical, and easier to follow, especially when the problem involves multiple variables or stakeholders.
It encourages deeper analysis
One of the main reasons problems recur is that teams stop at the first explanation that seems reasonable. These initial explanations are often symptoms rather than root causes.
For instance, missed deadlines may be attributed to poor execution, but a deeper analysis might reveal unclear requirements, inefficient workflows, or lack of ownership. A fishbone diagram encourages teams to break down each cause further and ask deeper questions, helping them move beyond surface-level thinking and uncover what's actually driving the problem.
It supports systems thinking
Most real-world problems are not caused by a single factor. They arise from a combination of issues across people, processes, tools, and external conditions.
The fishbone diagram supports this broader perspective by helping teams see how different factors interact with each other. Instead of isolating one issue, it allows teams to understand the system as a whole, which is essential for designing solutions that are sustainable rather than temporary.
It improves collaboration
Many problems span across teams and functions, making it difficult to identify causes from a single perspective. A fishbone diagram creates a shared structure that allows individuals from different roles to contribute their insights in a coordinated way.
This collaborative approach leads to a more complete understanding of the problem. It also reduces bias, as the analysis is shaped by multiple viewpoints rather than a single assumption.
It reduces guesswork
Without a structured method, teams often rely on instinct or experience to explain problems. While this can lead to quick decisions, it doesn't always lead to accurate ones.
A fishbone diagram encourages a more disciplined approach. It prompts teams to explore different possibilities, question their assumptions, and validate causes with evidence. This results in better decision-making and solutions that are more likely to address the root of the issue.
When should you use a fishbone diagram?
A fishbone diagram is not necessary for every issue. It's most useful when the problem is complex, recurring, or difficult to explain with one obvious cause.
Use it when a problem keeps repeating
If the same issue appears again and again, it's usually a sign that previous fixes addressed the symptom, not the root cause. A fishbone diagram helps teams step back and examine why the issue continues to occur.
For example, if customer complaints keep rising even after hiring more support agents, the issue may not be staffing. It may be related to unclear product information, broken escalation paths, poor onboarding, or a weak internal knowledge base.
Use it when the cause is not obvious
Some problems are easy to diagnose. Others aren't. When there are several possible explanations and no clear answer, a structured method is needed.
The fishbone diagram is useful here because it gives teams a practical way to explore all major contributing factors before deciding what the real issue is.
Use it when several teams or systems are involved
Many problems emerge at the point where teams connect. Handoffs, approvals, reporting, and dependencies are common areas where issues develop.
A fishbone diagram helps map these intersections. It makes it easier to see whether the problem lies in one function or in the way several functions work together.
Use it when the goal is long-term improvement
If the purpose isn't just to solve one immediate issue but to improve a process and prevent the same problem from returning, deeper analysis is necessary.
This is one of the best times to use a fishbone diagram because it helps teams uncover structural weaknesses, not just visible outcomes.
Understanding fishbone diagram categories
A fishbone diagram becomes far more useful when causes are grouped into meaningful categories. These categories are the main branches of the diagram, and they help teams examine the problem from multiple angles rather than focusing only on what seems most obvious.
For example, if project delivery is delayed, the cause might be related to people, such as unclear ownership. It could also be related to process, such as too many approvals, or technology, such as poor visibility in project tracking tools. Categories make it easier to organize these causes clearly and compare them.
Without categories, analysis can become messy. Teams may spend too much time on one explanation and overlook other factors that matter just as much. Categories create a balanced structure and improve the quality of thinking.
What is the 6M model in a fishbone diagram?
One of the most common ways to structure a fishbone diagram is by using the 6M model. This framework is widely used in manufacturing, quality management, operations, and process improvement, but its logic also applies well to business teams.
The 6M model includes six major categories of causes:
Man, often updated to People
Machine
Method
Material
Measurement
Mother Nature, often updated to Environment
The reason this framework is useful is simple: it gives teams a reliable starting point. Instead of beginning with a blank canvas and guessing where the problem might be coming from, they can explore each of these six areas one by one.
This prevents narrow thinking and makes the analysis more complete.
The 6M categories explained
People
The people category covers human-related factors that may contribute to the problem. This includes skills, training, communication, workload, supervision, role clarity, and execution quality.
This category should not be used as a shortcut for blame. The real purpose is to understand whether the human side of the system is being supported properly. For example, repeated mistakes may not come from carelessness. They may result from weak onboarding, unclear instructions, or unrealistic workload expectations.
Machine
The machine category refers to tools, systems, equipment, or technology involved in the process. In manufacturing, this could mean physical equipment. In business settings, it often includes software platforms, dashboards, project management systems, automation tools, or internal infrastructure.
Problems in this category may include system downtime, poor integration, outdated tools, slow performance, or lack of automation. These issues can create friction and lead to delays, errors, or inconsistency.
Method
Method focuses on how the work is done. This includes workflows, procedures, handoffs, approvals, and standard operating practices.
This is often one of the most important categories in root cause analysis because poorly designed processes create recurring issues even when people are capable and tools are available. If the sequence of work is unclear, too slow, or full of unnecessary complexity, the outcome will suffer.
Material
Material includes the inputs needed for the process. In manufacturing, this refers to raw materials and components. In service or business environments, it may include data, briefs, requirements, content, documentation, or source information.
If inputs are incomplete, inaccurate, inconsistent, or outdated, the quality of the output will decline. This is why many execution problems are actually input problems.
Measurement
Measurement refers to the way performance is tracked, monitored, and evaluated. This includes metrics, reporting systems, dashboards, feedback loops, audits, and quality checks.
This category matters because teams can only manage what they can see clearly. If measurement systems are weak or misleading, they may focus on the wrong issue, miss important patterns, or make poor decisions.
Environment
Environment includes the surrounding conditions that influence the process. This may include regulations, workspace setup, organizational culture, market conditions, seasonal changes, or external dependencies.
These factors are often ignored because they seem indirect, but they can have a major impact on performance. Looking at environment helps teams account for the broader context in which the process operates.
How to create a fishbone diagram step by step
A fishbone diagram is easy to draw, but using it effectively requires more than sketching categories and listing random causes. Each step should be done carefully so the final analysis is useful and actionable.
Step 1: Define the problem clearly
The quality of your fishbone diagram depends heavily on the quality of your problem statement. If the problem is vague, the analysis will also be vague.
A weak statement such as “delivery is delayed” does not provide enough direction. A better statement would be: “Project delivery timelines exceeded planned deadlines by an average of 10 days over the past quarter.”
A strong problem statement should be specific, measurable, and clear enough that everyone understands exactly what is being analyzed. This prevents confusion later and keeps the discussion focused.
Step 2: Choose the right categories
Once the problem is defined, the next step is to choose the main categories that will form the major branches of the diagram. In many cases, the 6M model works well. In business settings, categories like people, process, technology, data, policy, and environment may feel more natural.
The goal here is not to create a perfect taxonomy. The goal is to ensure that the team looks at the problem from every major angle that matters.
Step 3: Brainstorm possible causes under each category
Now the team begins identifying all possible causes that may be contributing to the problem. This step should be open and collaborative.
At this stage, it's important not to judge ideas too quickly. The goal is to capture possibilities before deciding which ones are most important. Encourage people from different roles to contribute what they're seeing from their side of the process.
For example, if the problem is delayed campaign execution, the team might identify causes such as unclear briefs under material, too many review steps under method, and lack of automation under machine.
Step 4: Go deeper by asking why
This is where the fishbone diagram becomes much more than a brainstorming tool. First-level causes are often just surface explanations. To reach root causes, the team needs to go deeper.
Take each likely cause and ask why it exists. Then ask why again, if needed.
For example:
Approvals are delayed
Why? Because too many teams need to sign off
Why? Because decision authority is unclear
Why? Because the workflow was never updated after the team expanded
Now the discussion is moving toward something truly actionable.
Step 5: Validate the likely causes
A fishbone diagram helps generate hypotheses, but it doesn't prove them by itself. Once likely causes are identified, they should be validated using data, observation, interviews, or process reviews.
For example, if the team believes workload is the problem, compare actual capacity and demand. If tool inefficiency is suspected, review usage patterns or system delays. If poor handoffs are blamed, examine how information moves between teams.
This step is essential because it prevents action based on assumption.
Step 6: Identify the root causes
After validation, identify the causes that have the strongest impact on the problem and the clearest evidence behind them. A root cause is not simply a deeper cause. It's a cause that, when addressed, meaningfully reduces the likelihood of the problem happening again.
This distinction matters. The goal is not to sound analytical; the goal is to find the causes that truly change outcomes.
Step 7: Turn analysis into action
The final step is to convert insights into clear corrective actions. For each root cause, define what should change, who owns the action, and how success will be measured.
This is where root cause analysis becomes valuable. Without action, the fishbone diagram remains a thoughtful exercise. With action, it becomes a tool for continuous improvement.
In practice, visual collaboration can make this process much easier. When teams map causes, sub-causes, and actions in a shared workspace, they can align faster and refine ideas more clearly. For example, in Vani, teams can use a fishbone diagram template to structure root cause analysis visually, collaborate in real time, and move from diagnosis to action with better clarity.
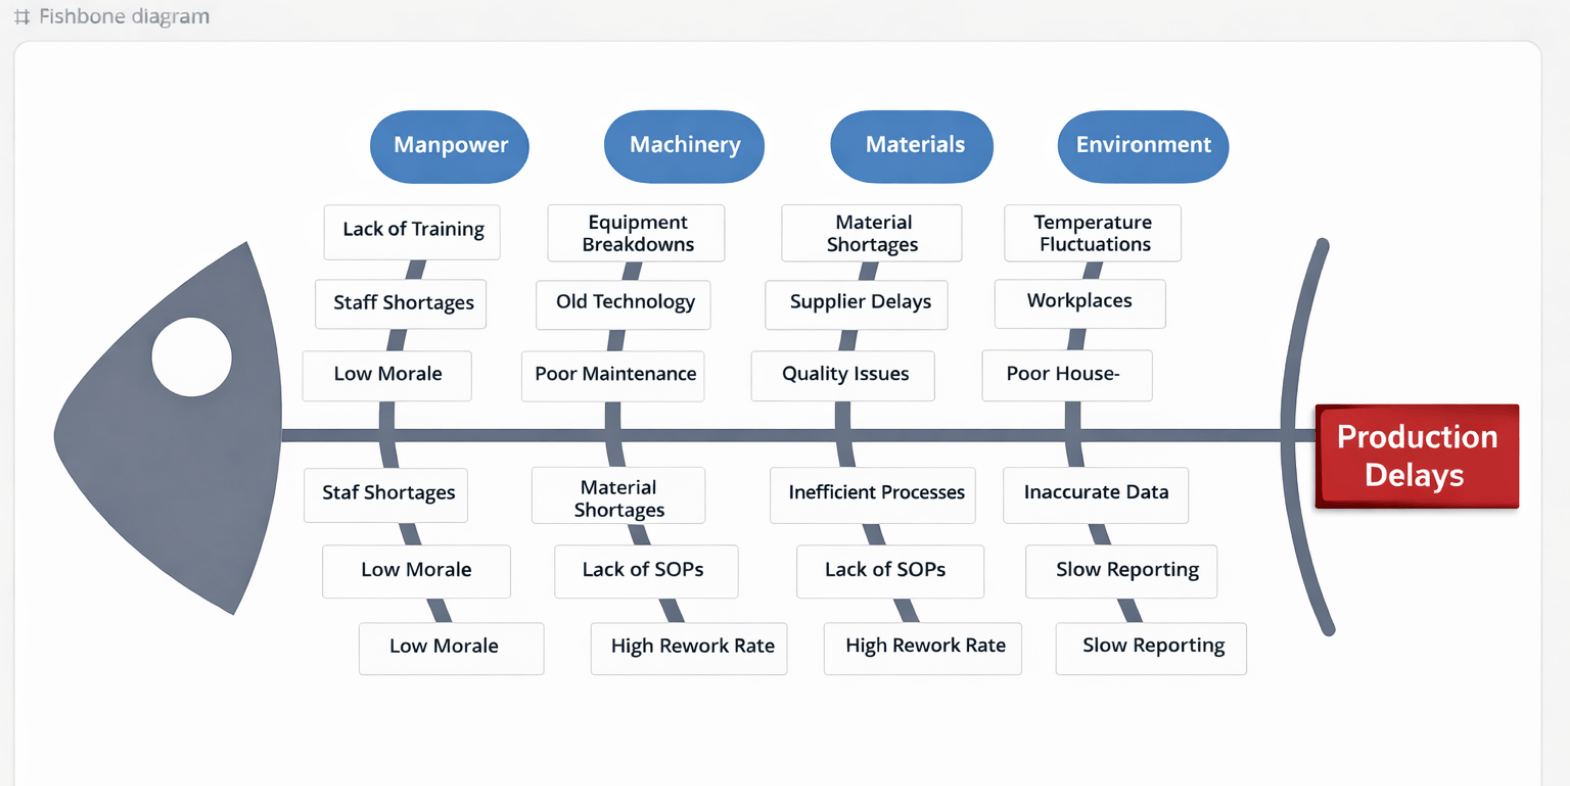
Practical example of a fishbone diagram
Consider a team facing rising customer support resolution times. At first, it may look like a performance issue. But once they map the problem using a fishbone diagram, several contributing factors may appear.
Under People, they may find that newer agents aren't trained to handle complex cases. Under Method, they may notice unclear escalation rules. Under Machine, they may identify poor visibility in the ticketing system. Under Measurement, they may discover that reporting tracks response time but not actual resolution quality.
By examining these branches in detail, the team may conclude that the root causes are incomplete training, weak escalation design, and poor operational visibility. Those findings lead to much stronger corrective actions than simply telling the team to work faster.
Best practices for effective root cause analysis
To get the most value from a fishbone diagram, start with a precise problem statement, involve the right people, and focus on systems rather than blame. Ask deeper questions, validate important causes with evidence, and prioritize the causes that are both impactful and actionable.
A fishbone diagram works best when it is used thoughtfully, not mechanically.
Common mistakes to avoid
Some common mistakes reduce the value of fishbone analysis. These include defining the problem too broadly, stopping at surface-level causes, relying on opinion without validation, ignoring key categories, and failing to follow through with action.
Avoiding these mistakes is often just as important as following the right steps.
Conclusion
The fishbone diagram is one of the most practical tools for root cause analysis because it combines simplicity with structure. It helps teams move beyond quick fixes, understand the deeper factors behind recurring issues, and make better decisions about what to change.
When used properly, it improves clarity, strengthens collaboration, and leads to solutions that address the real source of the problem.
If your team wants to solve problems more effectively and prevent them from returning, learning how to use a fishbone diagram well is a valuable step forward.