- HOME
- Technology & Trends
- What is a UML diagram? Types, examples, and how to create one
What is a UML diagram? Types, examples, and how to create one
- Last Updated : September 22, 2026
- 3 Views
- 9 Min Read


A UML diagram is a visual representation of a software system created using Unified Modeling Language, commonly known as UML.
UML provides a standardized set of elements and relationships that can be used to represent different parts of a system. Depending on the type of diagram, it can show classes, users, workflows, components, interactions, states, or deployment environments.
For example, consider an online shopping application. The system may have customers, products, orders, payments, databases, and several backend services. A UML diagram can help the team look at this system from different perspectives.
One diagram might show how customers, orders, and products are related. Another might show what happens after a customer places an order, including communication between the application, payment service, and database.
Both diagrams represent the same system, but they explain different things. This is why UML has different diagram types instead of trying to represent everything in one diagram.
How do UML diagrams work?
UML diagrams use standard visual elements to represent parts of a system and the relationships between them. Because these elements have defined meanings, UML diagrams provide a common visual language. A developer, architect, or another team member who understands UML can look at the diagram and understand what the elements and relationships are meant to represent.
The type of UML diagram you choose depends on what you want to explain. If you want to understand the structure of the system, you use one type of diagram. If you want to understand what happens during a process or interaction, you use another.
Structural and behavioral UML diagrams
UML diagrams are generally divided into two main categories: structural diagrams and behavioral diagrams.
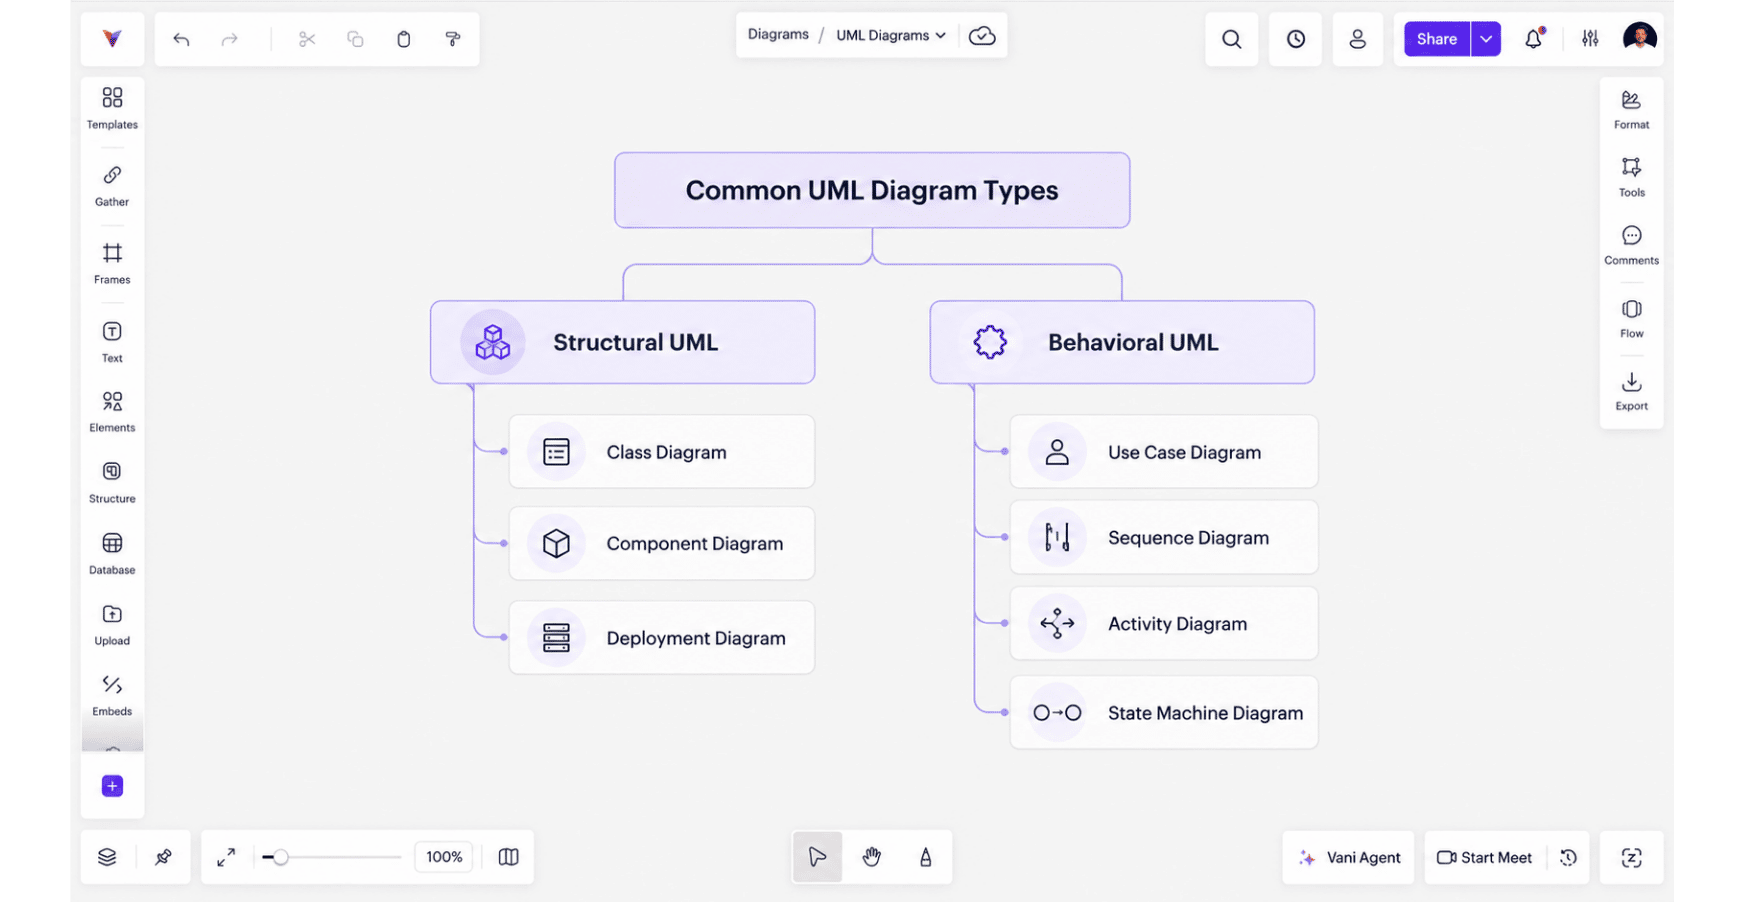
Structural diagrams focus on what the system contains and how those parts are connected. They are used to represent things such as classes, components, packages, and deployment environments.
Behavioral diagrams focus on what happens within the system. They can show how users interact with the system, how workflows progress, how components communicate, or how an object moves from one state to another.
You do not need to use every UML diagram type in a project. Most teams choose the diagrams that are useful for the part of the system they are working on.
Common types of UML diagrams
Class diagram
A class diagram shows the classes in a system and the relationships between them. It can also include class attributes, operations, inheritance, and associations.
For example, a library management system may include classes such as Member, Book, Loan, and Librarian. The diagram can show that a member can borrow books, a loan is connected to a particular book, and a librarian manages lending operations.
Class diagrams are commonly used when designing object-oriented software or when teams need to understand how the main objects in an application are related.
Use case diagram
A use case diagram shows how users or external systems interact with an application.
The people or systems interacting with the application are called actors, while the actions they perform are represented as use cases.
For example, in a project management application, a team member may be able to create a task, update its status, and add comments. A project admin may also be able to manage members and project settings.
Use case diagrams are useful when teams are defining requirements or trying to understand what different users should be able to do in the system.
Sequence diagram
A sequence diagram shows how different parts of a system communicate and the order in which those interactions happen.
For example, when a user signs in to an application, the application may send the login details to an authentication service. The service checks the credentials and returns a response. If the login is successful, the application creates a session and gives the user access.
This might be easy to explain when only two systems are involved. But when several services and APIs are part of the same interaction, a sequence diagram makes it much easier to follow what happens and in what order.
Sequence diagrams are useful for API flows, service-to-service communication, authentication, and other scenarios where the order of interactions matters.
Activity diagram
An activity diagram shows how a process or workflow moves from one step to another.
For example, an expense approval workflow may begin when an employee submits a claim. The manager reviews it, finance verifies the information, and the claim is either approved or sent back for changes.
An activity diagram can also show decision points and alternative paths, which makes it useful for workflows that do not always follow the same sequence.
Teams can use activity diagrams for both software workflows and business processes.
State machine diagram
A state machine diagram shows the different states an object can be in and how it moves between those states.
For example, an order might move from Pending to Confirmed, Processing, Shipped, and Delivered. It may also move to Cancelled or Returned depending on what happens.
This type of diagram is useful when the current state of an object determines what can happen next. Orders, support tickets, subscriptions, and approval requests are common examples.
Component diagram
A component diagram shows the main software components in a system and the dependencies between them.
For example, a SaaS application may include a web application, authentication service, billing service, notification service, and database. A component diagram can show how these parts are connected without going into the details of the classes inside each service.
This makes component diagrams useful for architecture discussions, technical documentation, and helping new developers understand the overall structure of an application.
Deployment diagram
A deployment diagram shows where software components run and how they are connected to the infrastructure.
It can include servers, devices, virtual machines, containers, databases, or cloud environments.
For example, a deployment diagram may show a user accessing a web application hosted in a cloud environment, with backend services connecting to a separate database.
A component diagram tells you what the main parts of the software are. A deployment diagram tells you where those parts run.
How to choose the right UML diagram
The easiest way to choose a UML diagram is to start with what you are trying to understand.
If you want to understand how classes are related, use a class diagram. If you want to see what different users can do in the system, use a use case diagram.
If the question is about how services communicate, use a sequence diagram. If you are trying to map a process or workflow, an activity diagram is more suitable.
A state machine diagram is useful when you need to understand how an object moves between different states. For overall software architecture, use a component diagram, and when you need to understand how the application is deployed, use a deployment diagram.
A single project can use several UML diagrams because each one explains a different part of the same system.
How to create a UML diagram
Start by deciding what the diagram needs to explain. A broad goal such as "show the system architecture" can easily lead to a diagram that contains too much information. A more specific goal, such as "show how the payment service communicates with the order service," gives the diagram a clear scope.
Next, identify the elements that are relevant to that question. These may include actors, classes, components, activities, or states depending on the type of UML diagram you are creating.
Once the elements are clear, add the relationships between them using the correct UML notation. The relationships are important because they explain how different parts of the system are connected or how they interact.
The layout should also be easy to follow. Related elements should stay close together, connectors should be clear, and unnecessary details should be avoided. If the diagram starts becoming too large, it is usually better to split it into smaller diagrams instead of trying to fit everything into one place.
Finally, review the diagram with the people who understand the system. This can help identify missing relationships, incorrect assumptions, or parts of the flow that were not considered earlier.
Common mistakes when creating UML diagrams
One of the most common mistakes is adding too much information. A UML diagram should explain a specific part of the system, not everything the system contains.
Another mistake is mixing different levels of detail. For example, showing one service as a single component while showing every internal class of another service can make the diagram difficult to understand.
Using the wrong UML relationship can also create confusion. Inheritance, association, composition, and dependency have different meanings, so they should not be used interchangeably.
UML diagrams should also be updated if teams continue using them as documentation. If the architecture changes but the diagram does not, it may end up giving people the wrong understanding of the system.
When should you use UML diagrams?
UML diagrams are useful when a system becomes difficult to explain through text or code alone.
Teams may use them while designing a new application, planning architecture, defining requirements, documenting an existing system, mapping API interactions, or reviewing technical changes.
They are also useful during onboarding. A component diagram can help a new developer understand the overall architecture before they start exploring individual services, while a sequence diagram can help them understand a specific interaction without having to trace the entire flow through the code.
UML is not necessary for every technical discussion. If a simple sketch explains the idea clearly, there may be no need to create a formal diagram. UML becomes useful when standard notation and a structured visual representation make the system easier to understand.
UML diagrams vs. flowcharts
UML diagrams and flowcharts both use visual elements such as shapes and connectors, but they are used for different purposes.
A flowchart shows the steps and decisions in a process. It can be used for technical or non-technical workflows, such as an approval process, customer support workflow, or onboarding process.
A UML diagram is mainly used to model software systems. Depending on the diagram type, it can represent classes, users, states, interactions, components, or deployment environments.
Activity diagrams can look similar to flowcharts because both show processes. The difference is that an activity diagram follows UML conventions and is used as part of a larger system model.
If you only need to explain a process, a flowchart may be enough. If you need to represent software structure or behavior using standardized notation, UML is more suitable.
Best practices for UML diagrams
Keep each diagram focused on one clear purpose. Avoid adding classes, components, or relationships that are not necessary for the reader to understand the part of the system being discussed.
Use UML notation consistently and make labels clear enough that someone else can understand the diagram without needing the person who created it to explain everything.
The level of detail should also match the audience. A developer may need more technical information than a stakeholder who only needs to understand the overall behavior of a feature.
When the diagram is important to the project, review it with the relevant team members and update it when the system changes. This helps the diagram remain useful instead of becoming outdated documentation.
Create UML diagrams in Vani
UML diagrams are often created while teams are still discussing how a system should work. Developers may be reviewing dependencies, architects may be looking at the overall structure, and product teams may need to understand how a feature behaves.
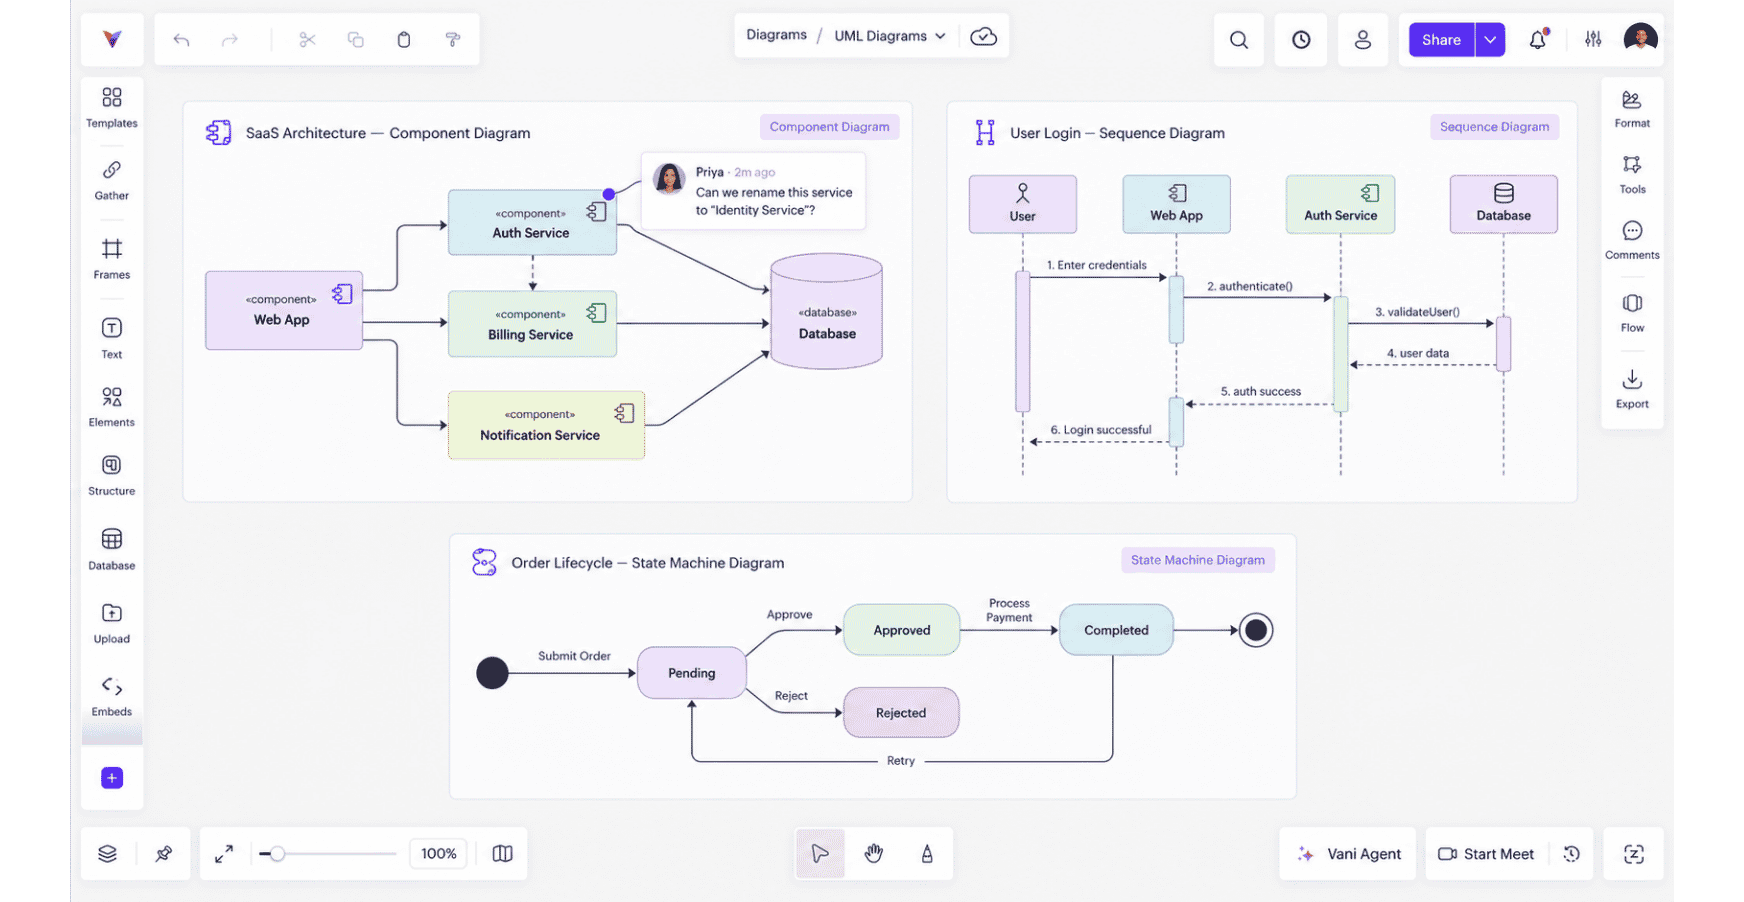
With Vani's UML Kit, teams can create UML diagrams in a shared visual workspace using UML elements. Instead of creating the diagram separately and sharing it later, teams can work on it together, review relationships, and leave comments directly in context.
Vani's infinite canvas also makes it possible to keep multiple related diagrams in the same workspace. A component diagram can show the overall architecture, while a sequence diagram explains a particular interaction and a state machine diagram shows how an important object moves through different states.
This helps teams keep the diagram and the discussions around it connected instead of spreading technical context across different tools.
Final thoughts
UML diagrams help teams understand software systems by turning technical information into visual models. Different diagram types make it possible to look at the same system from different perspectives, whether the focus is on classes, users, workflows, service interactions, states, architecture, or deployment.
The right UML diagram depends on what you are trying to explain. A useful diagram should have a clear purpose, include only the information that matters, and be easy for the people working on the system to understand.
With Vani's UML Kit, teams can create and collaborate on UML diagrams in a shared visual workspace, making it easier to discuss systems, review designs, and keep technical context connected as the work evolves.
FAQs
What does UML stand for?
UML stands for Unified Modeling Language. It is a standardized visual modeling language used to represent different aspects of a software system, including its structure, behavior, interactions, and architecture.
What are the main types of UML diagrams?
UML diagrams are broadly divided into structural diagrams and behavioral diagrams. Common types include class, use case, sequence, activity, state machine, component, and deployment diagrams.
Which UML diagram should I use?
It depends on what you want to understand. Use a class diagram for relationships between classes, a sequence diagram for interactions between services, an activity diagram for workflows, and a state machine diagram for changes in state. Component and deployment diagrams are useful when working with software architecture and infrastructure.
What is the difference between a UML diagram and a flowchart?
A flowchart mainly represents the steps and decisions within a process, while UML can model several aspects of a software system, including its structure, behavior, interactions, and deployment. UML also uses standardized notation across its different diagram types.
Can I create UML diagrams in Vani?
Yes. Vani's UML Kit provides UML elements that teams can use to create diagrams in a shared visual workspace. Teams can work on diagrams together, review relationships, add comments in context, and keep related diagrams and information in the same workspace.