- HOME
- Technology & Trends
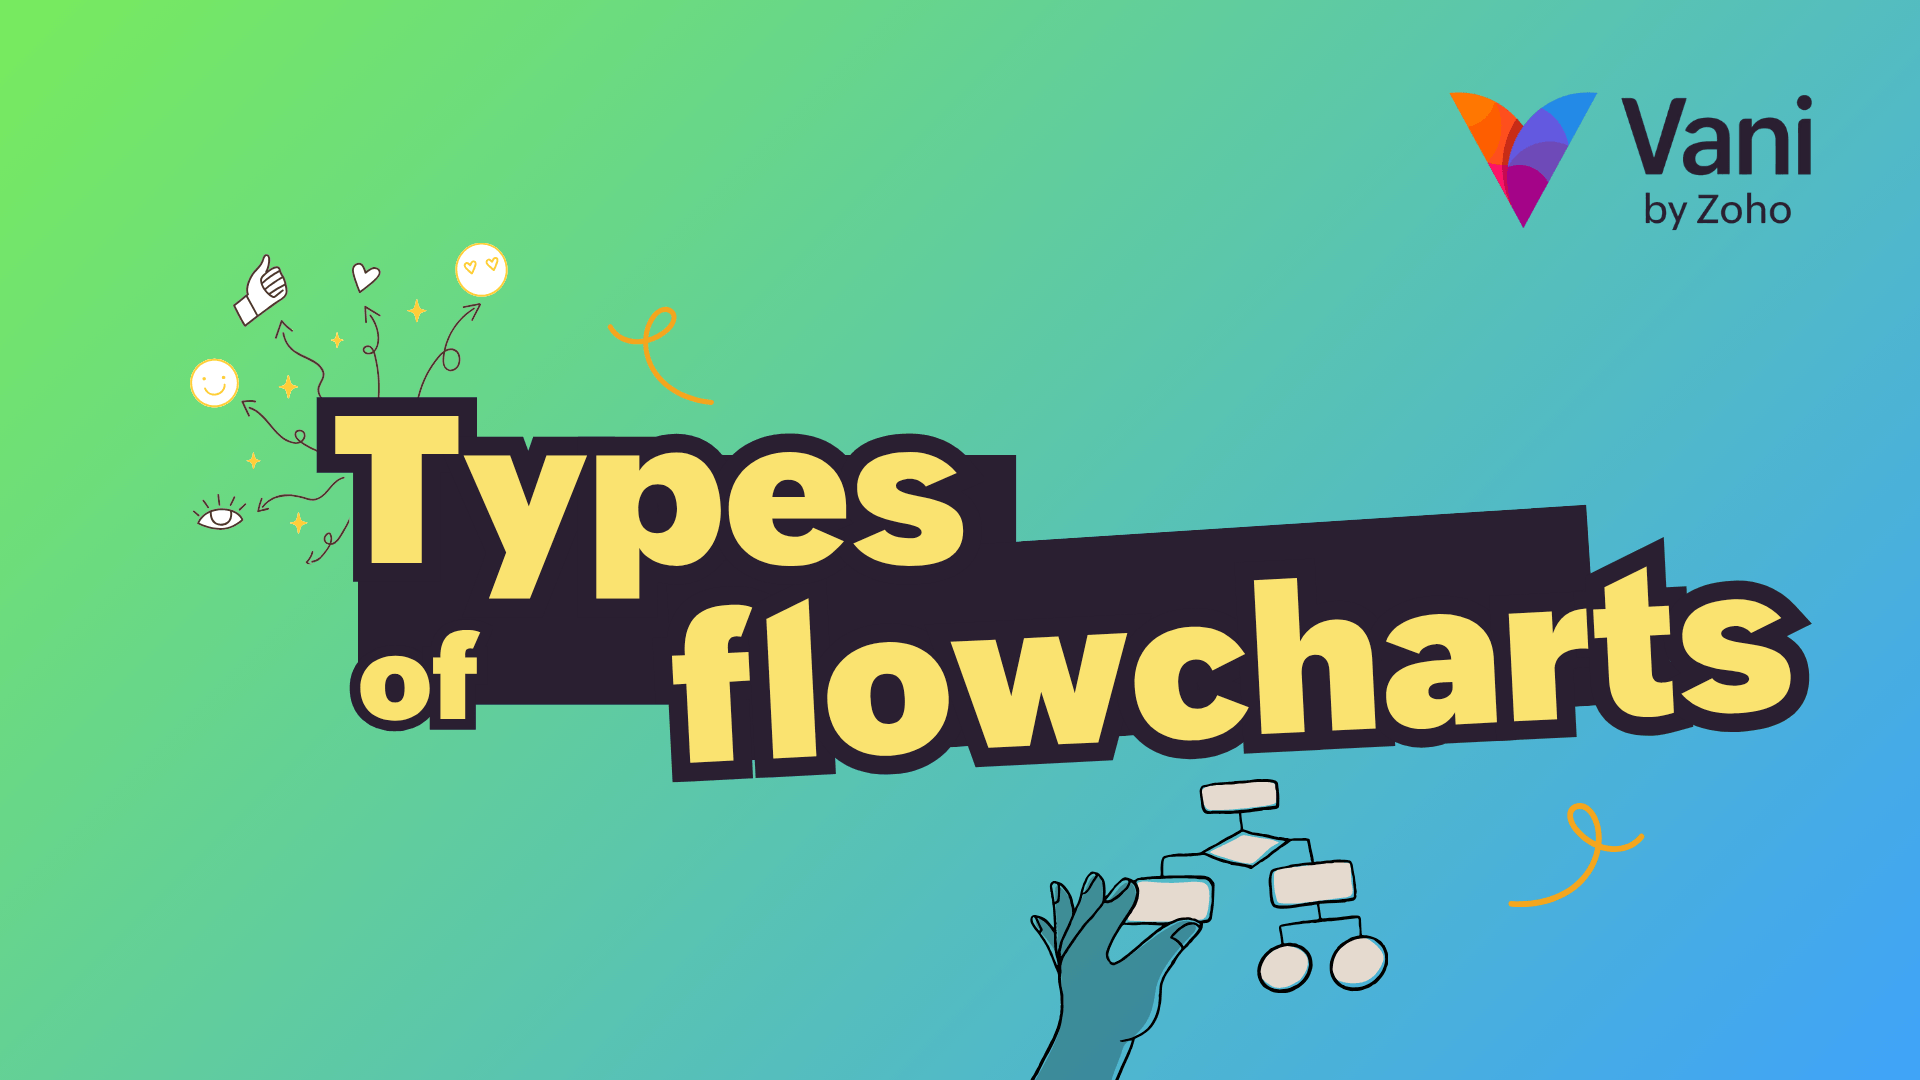
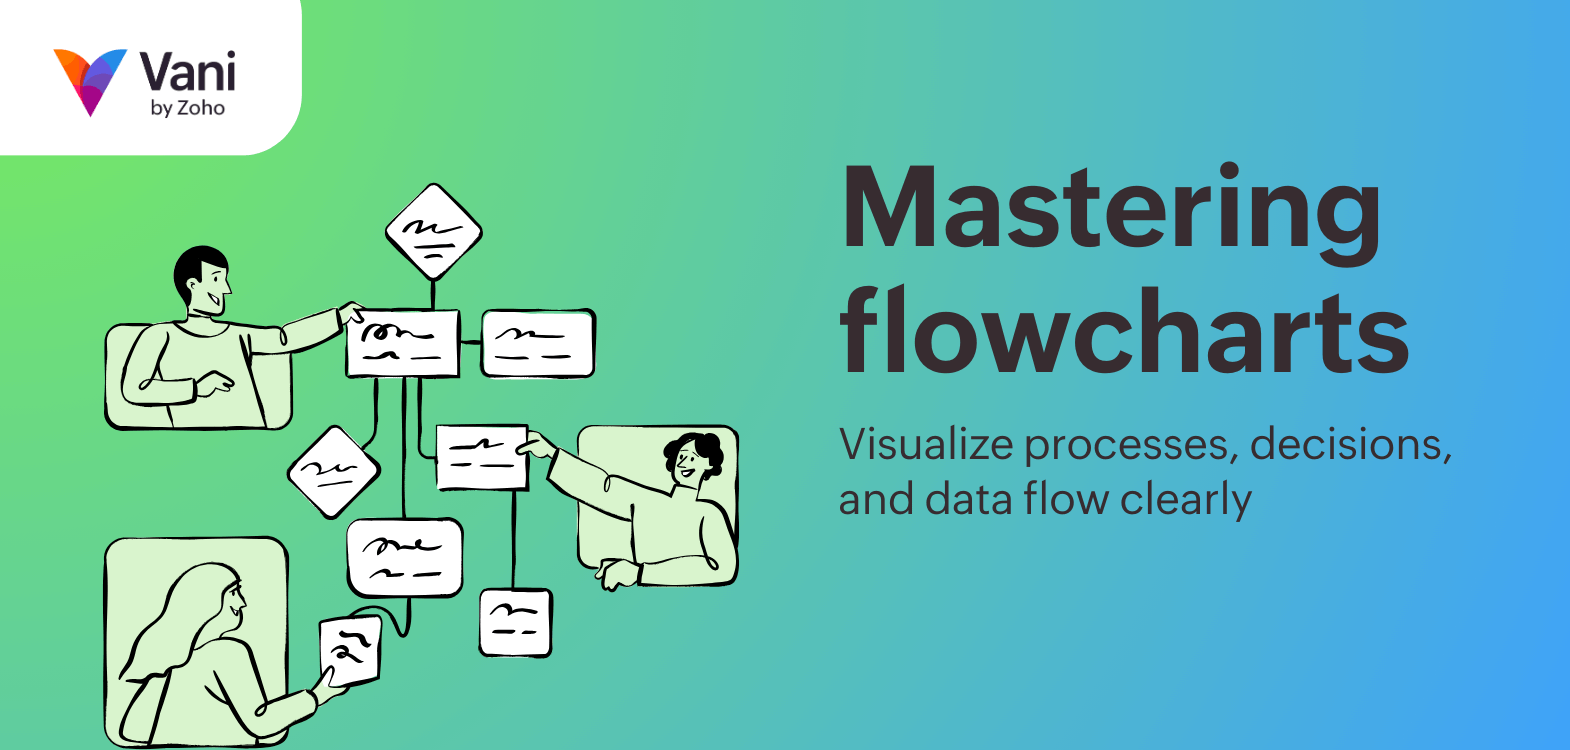
- Mastering flowcharts: Visualize processes, decisions, and data flow clearly
Mastering flowcharts: Visualize processes, decisions, and data flow clearly
- Last Updated : May 18, 2026
- 101 Views
- 10 Min Read
Think about the last time you went on a trip. Some parts were easy, straight roads where you just kept moving. At other times, you had to stop and choose a direction, or climb the same stairs again until you reached the right floor. What makes a journey like this easier is a map. Without one, it is easy to feel confused, or get lost.
Work processes are just the same. Whether you're making a decision, finishing a task, or getting something reviewed, things can quickly become unclear without a guide. That guide is a flowchart.
A flowchart shows each step in a process and how one step leads to the next. It helps teams understand what to do, follow a simple flow, and refer to it when needed.
In this blog post, we'll cover the basics of creating a flowchart, explain common loops, look at different types of flowcharts, and share a few best practices to keep in mind.
What is a flowchart?
A flowchart is a visual diagram that illustrates a process from start to finish. It uses simple, widely recognized symbols to represent each step and decision, allowing the entire workflow to be understood at a glance.
Flowcharts are used across many contexts, from classrooms and training materials to project management and software development. Any time a process feels complex or difficult to explain in words, a flowchart helps by laying out the flow visually and making the logic easier to follow.
Key elements of a flowchart
Flowcharts can vary in structure and complexity, but they're all built using these standard elements.
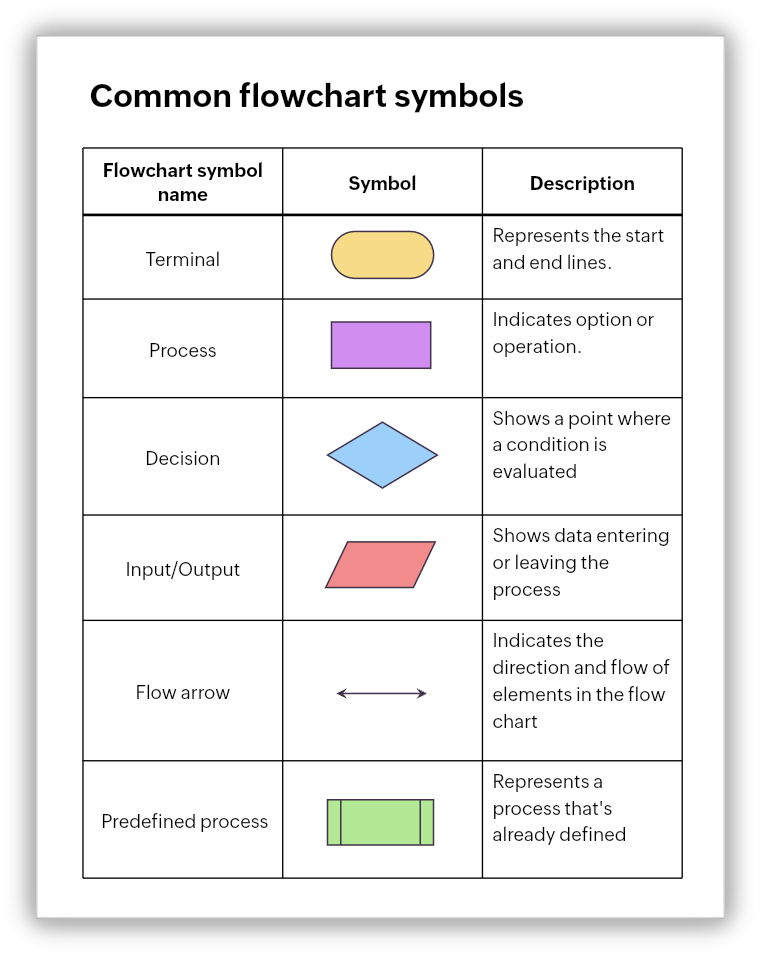
Together, these elements allow flowcharts to represent actions, inputs, outputs, services, or materials involved in a process. Consistent use of these components ensures that the flowchart remains easy to interpret.
Understanding loops in a flowchart
Not all processes move in a straight line. Many involve repetition, where a set of steps is repeated until a specific condition is met. In flowcharts, this repetition is represented using loops.
When to use a loop
- The process outcome depends on meeting a standard or expectation rather than completing a step just once.
- A workflow involves review, correction, or refinement before moving forward.
- The same group of steps applies to multiple items, entries, or cases within a single process.
- Skipping repetition would misrepresent how the process actually works in real life.
Common loop patterns
Loops can follow a few common patterns depending on when the condition is checked and what triggers the repetition.
For loop
The for loop runs a step a fixed number of times without relying on any external condition. This is ideal for processes where the repetition is predefined or predictable.
For instance, sending three reminder emails to a customer ensures follow-up without relying on unpredictable conditions.
While loop
In a while loop, the condition is evaluated before executing a step. If the condition is not satisfied, the step is skipped or repeated.
For example, filling out an online form where the system checks if all required fields are complete prevents incomplete submissions.
Do-while loop
In a do-while loop, the action occurs first, and then the condition is evaluated. This guarantees the step happens at least once, even if the condition is initially false.
For example, a payment system attempts a transaction. After each attempt, it checks whether the payment was successful. If the transaction fails, it's retried until it succeeds.
Nested loop
A nested loop occurs within another loop and is often used in complex processes where one repeated action contains another repeated action.
For example, in a quality check process, each product is tested multiple times (inner loop). Once all products in a batch are tested, the batch is reviewed again as a whole (outer loop).
Different types of flowcharts with examples
Once you understand the basic elements of a flowchart, the next step is knowing how those elements are used in different ways. The same symbols can be arranged to tell very different stories, depending on what you want to explain.
Each type of flowchart is designed to highlight a specific aspect of a process, whether it's the sequence of steps, the people involved, or the decisions that shape the outcome. Choosing the right type helps the flowchart communicate its message clearly.
Process flowchart
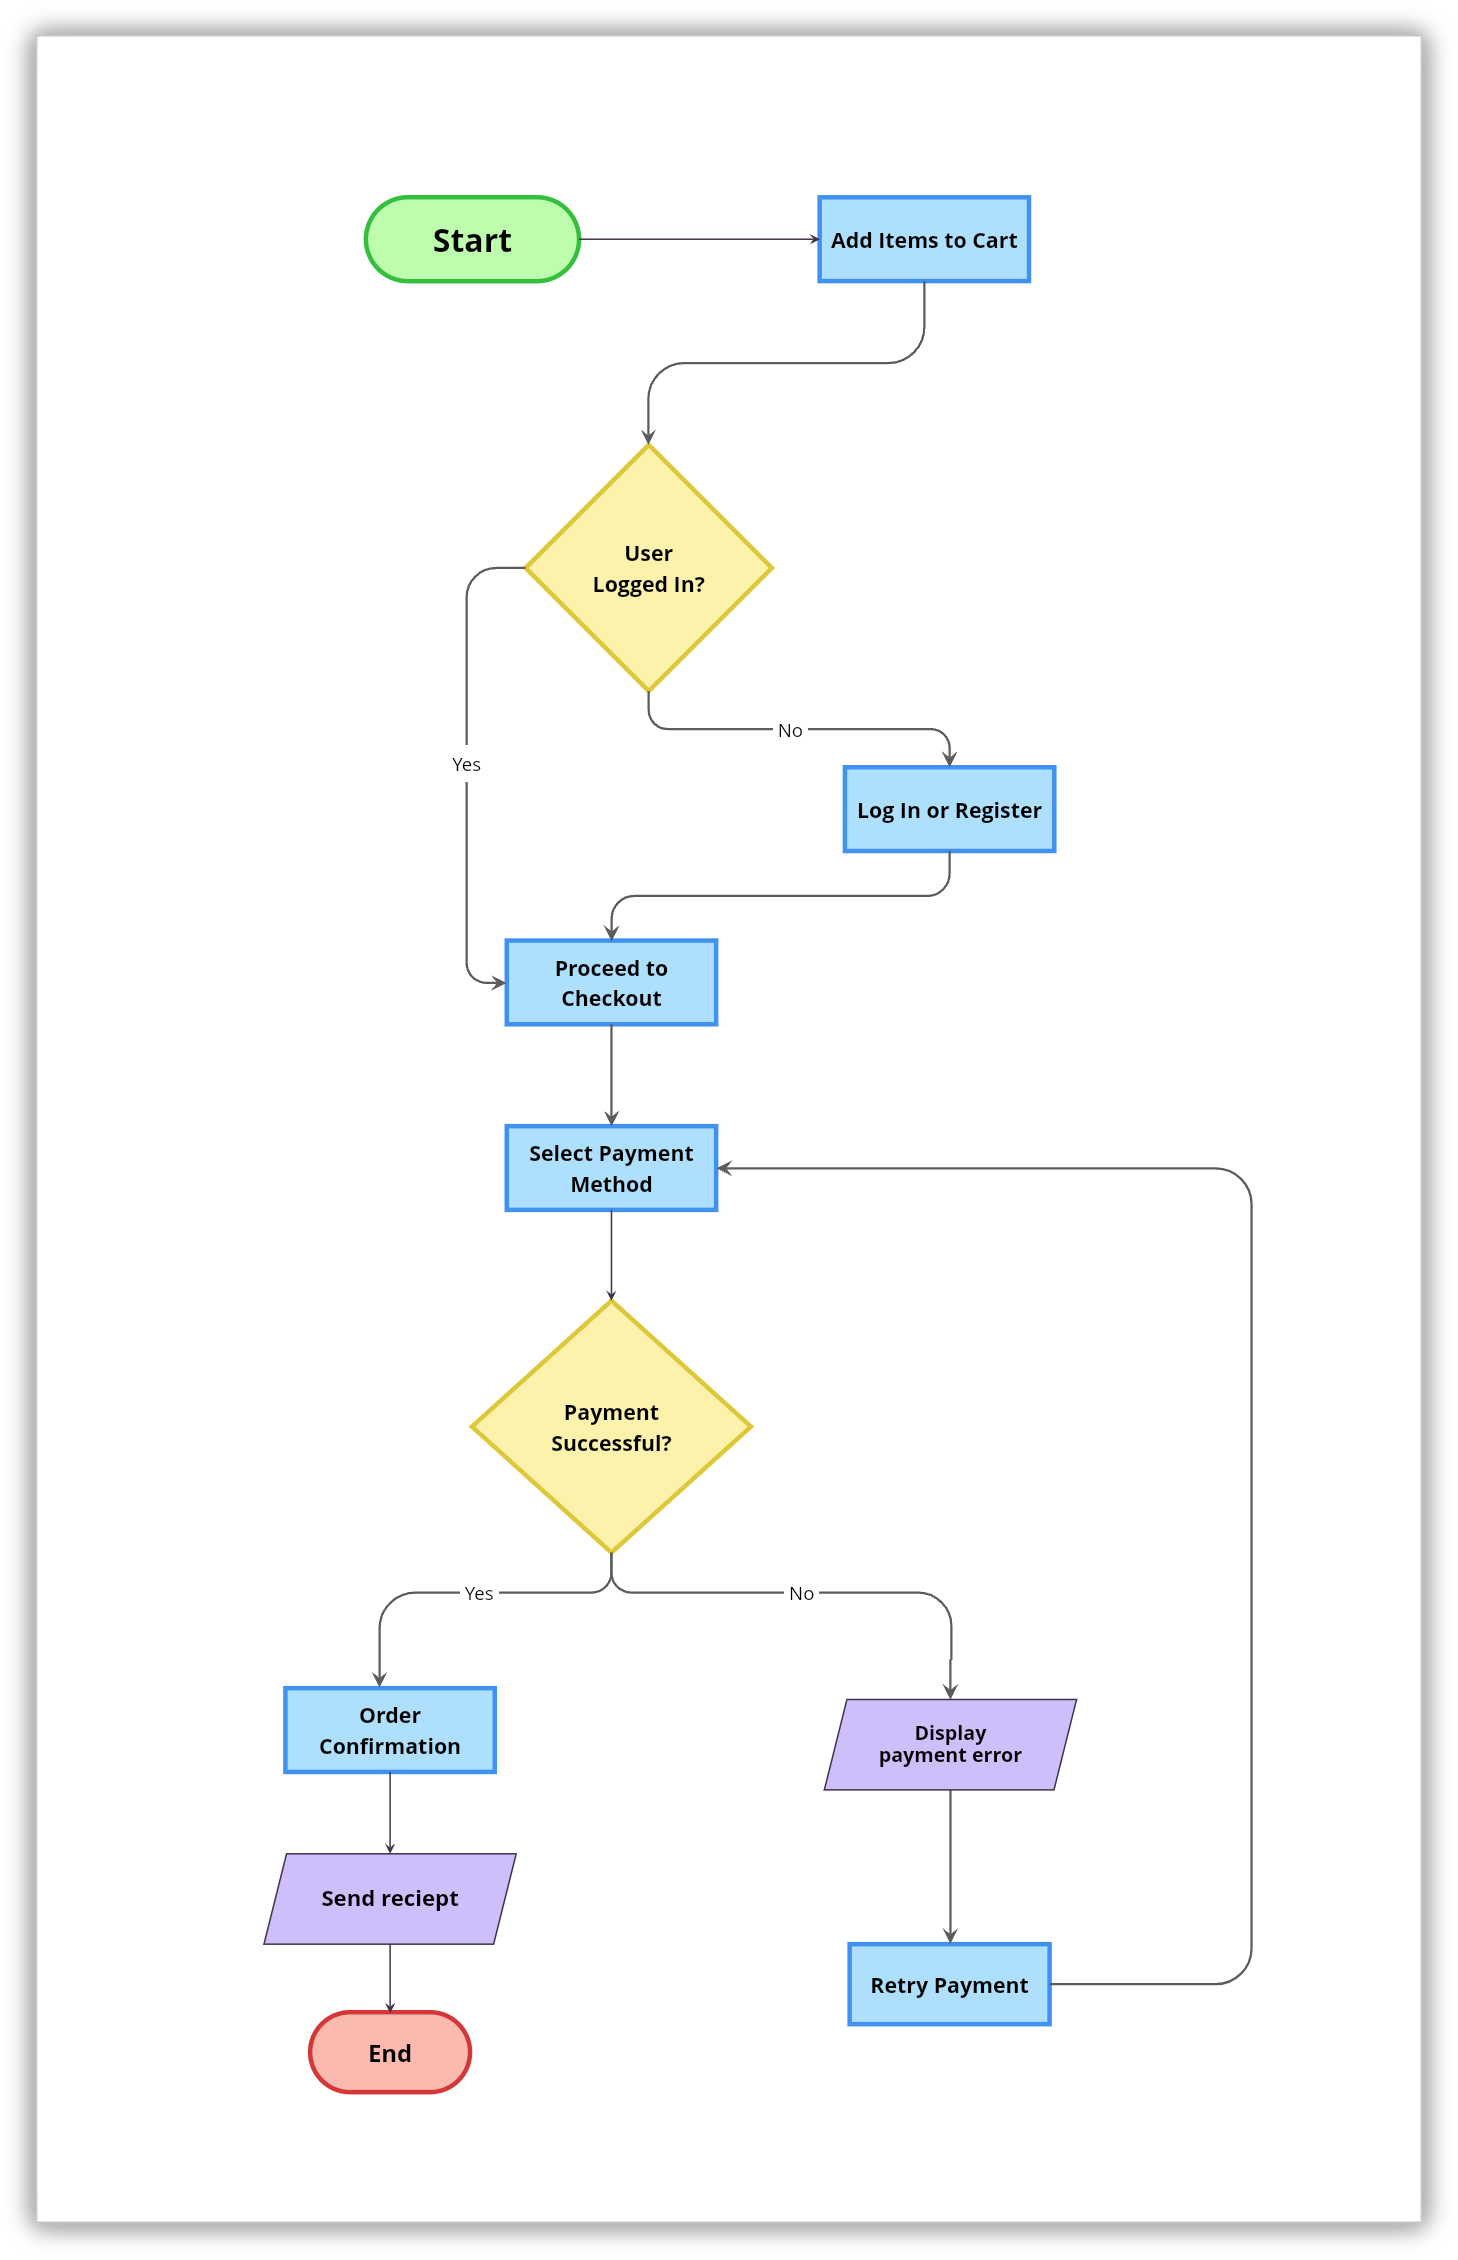
This is the most straightforward and widely used type of flowchart. It focuses on the order of steps in a process, showing how work progresses from start to finish. Process flowcharts are useful when you want to understand the overall structure of a task.
For example, here's a simple process chart that shows a basic online checkout process, starting from adding items to the cart and ending with order confirmation.
Workflow flowchart
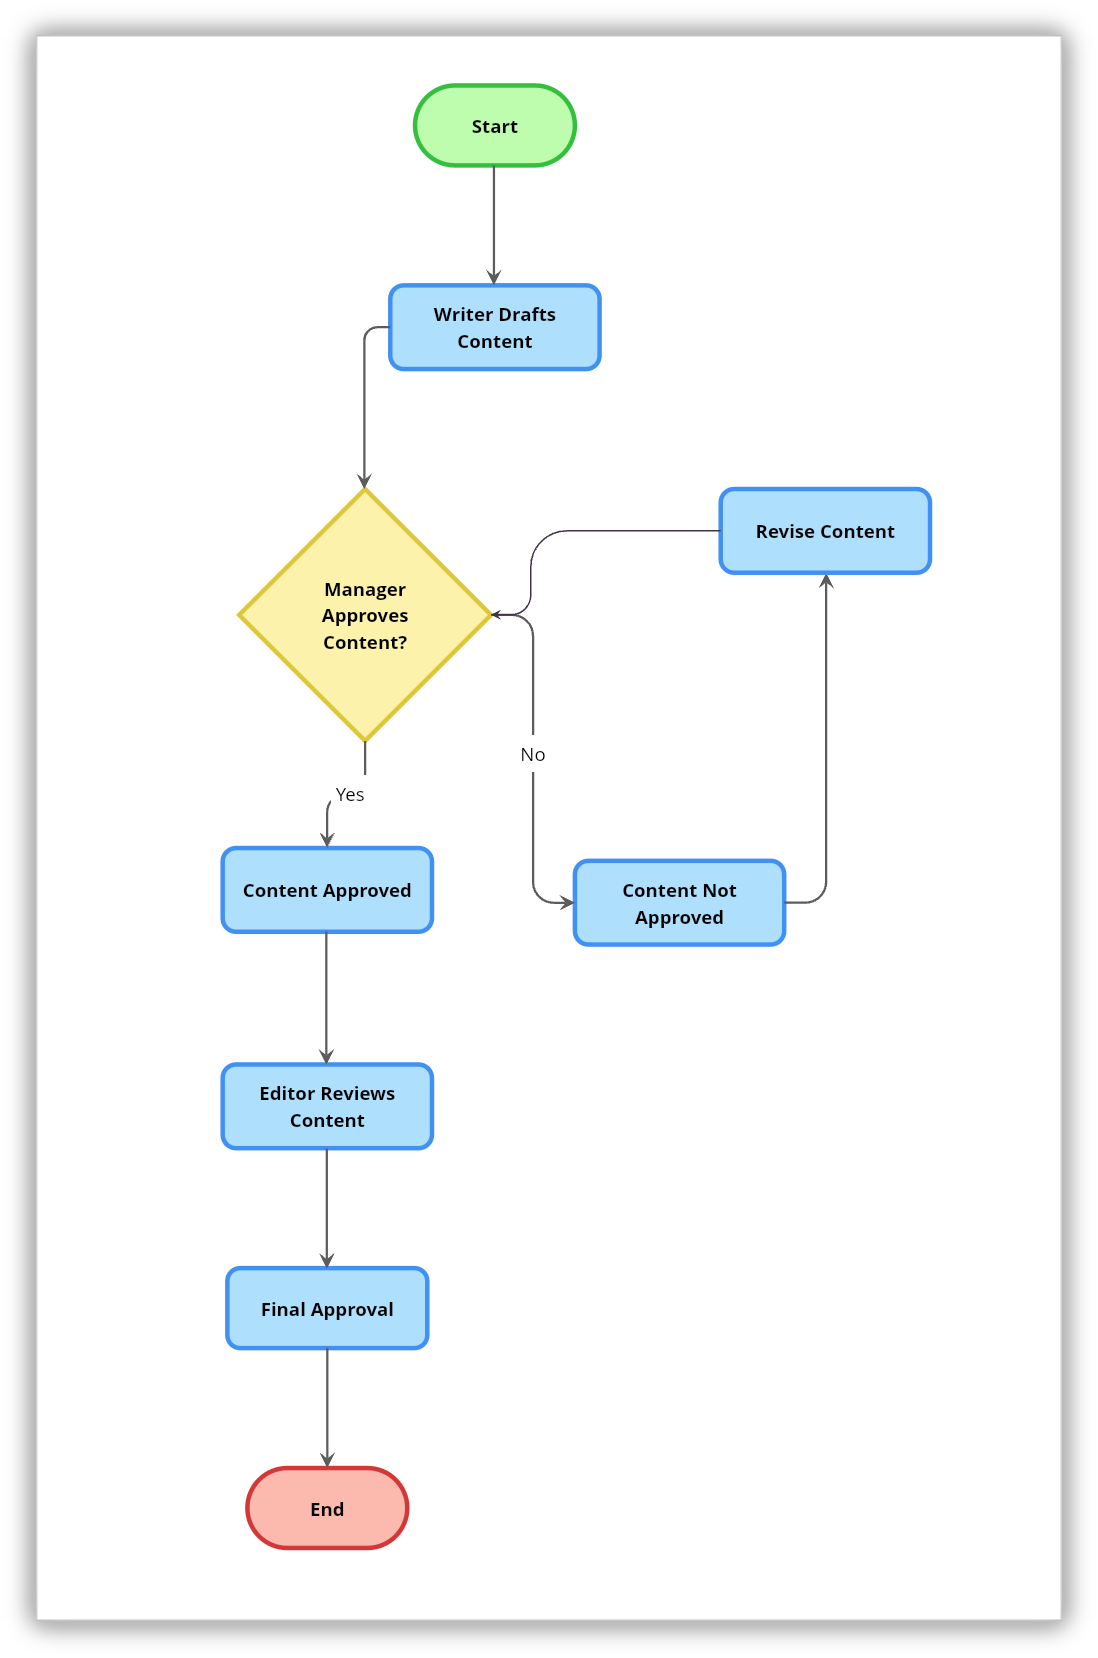
A workflow flowchart builds on the process flowchart by showing how tasks move between individuals, teams, or systems. It helps clarify responsibilities and hand offs, making it easier to see where work slows down or gets reassigned.
One common example is a content approval flow where a writer drafts content, the manager approves it, and an editor reviews it to make sure everything is perfect.
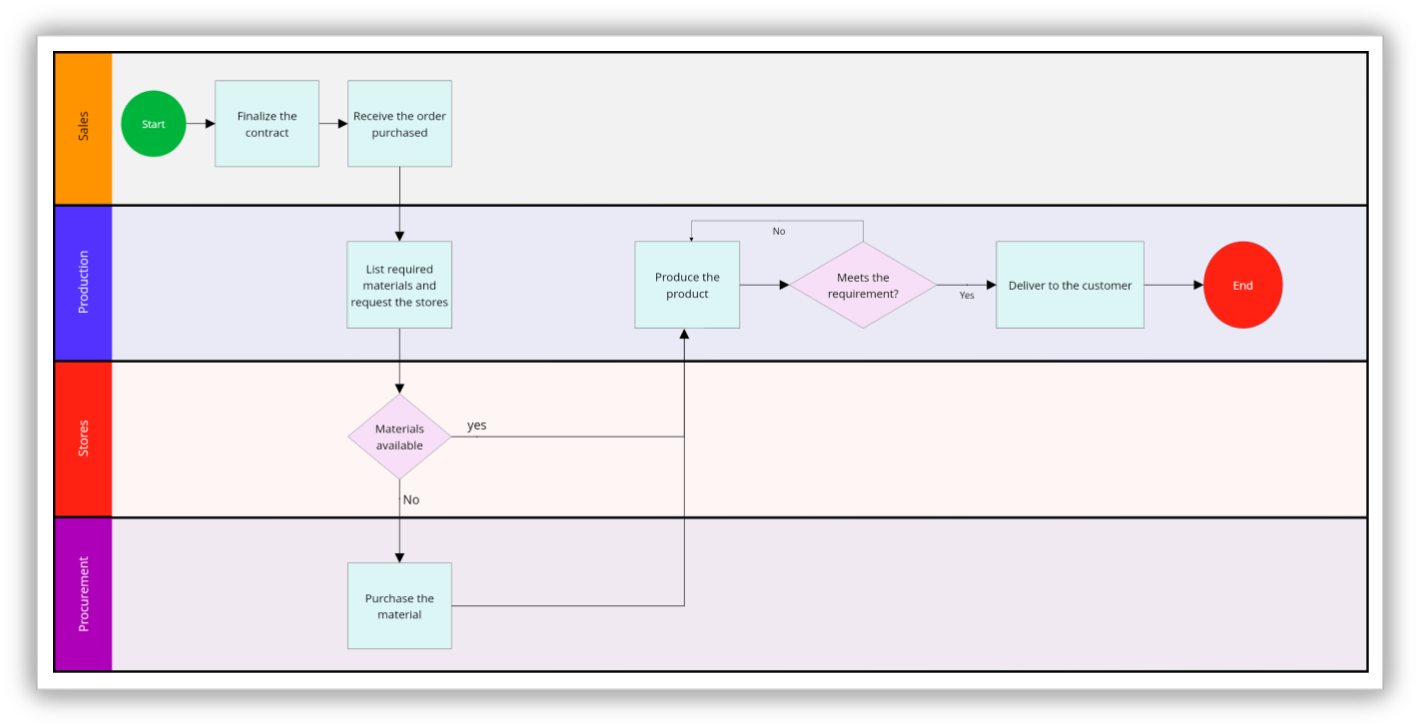
Swimlane flowchart
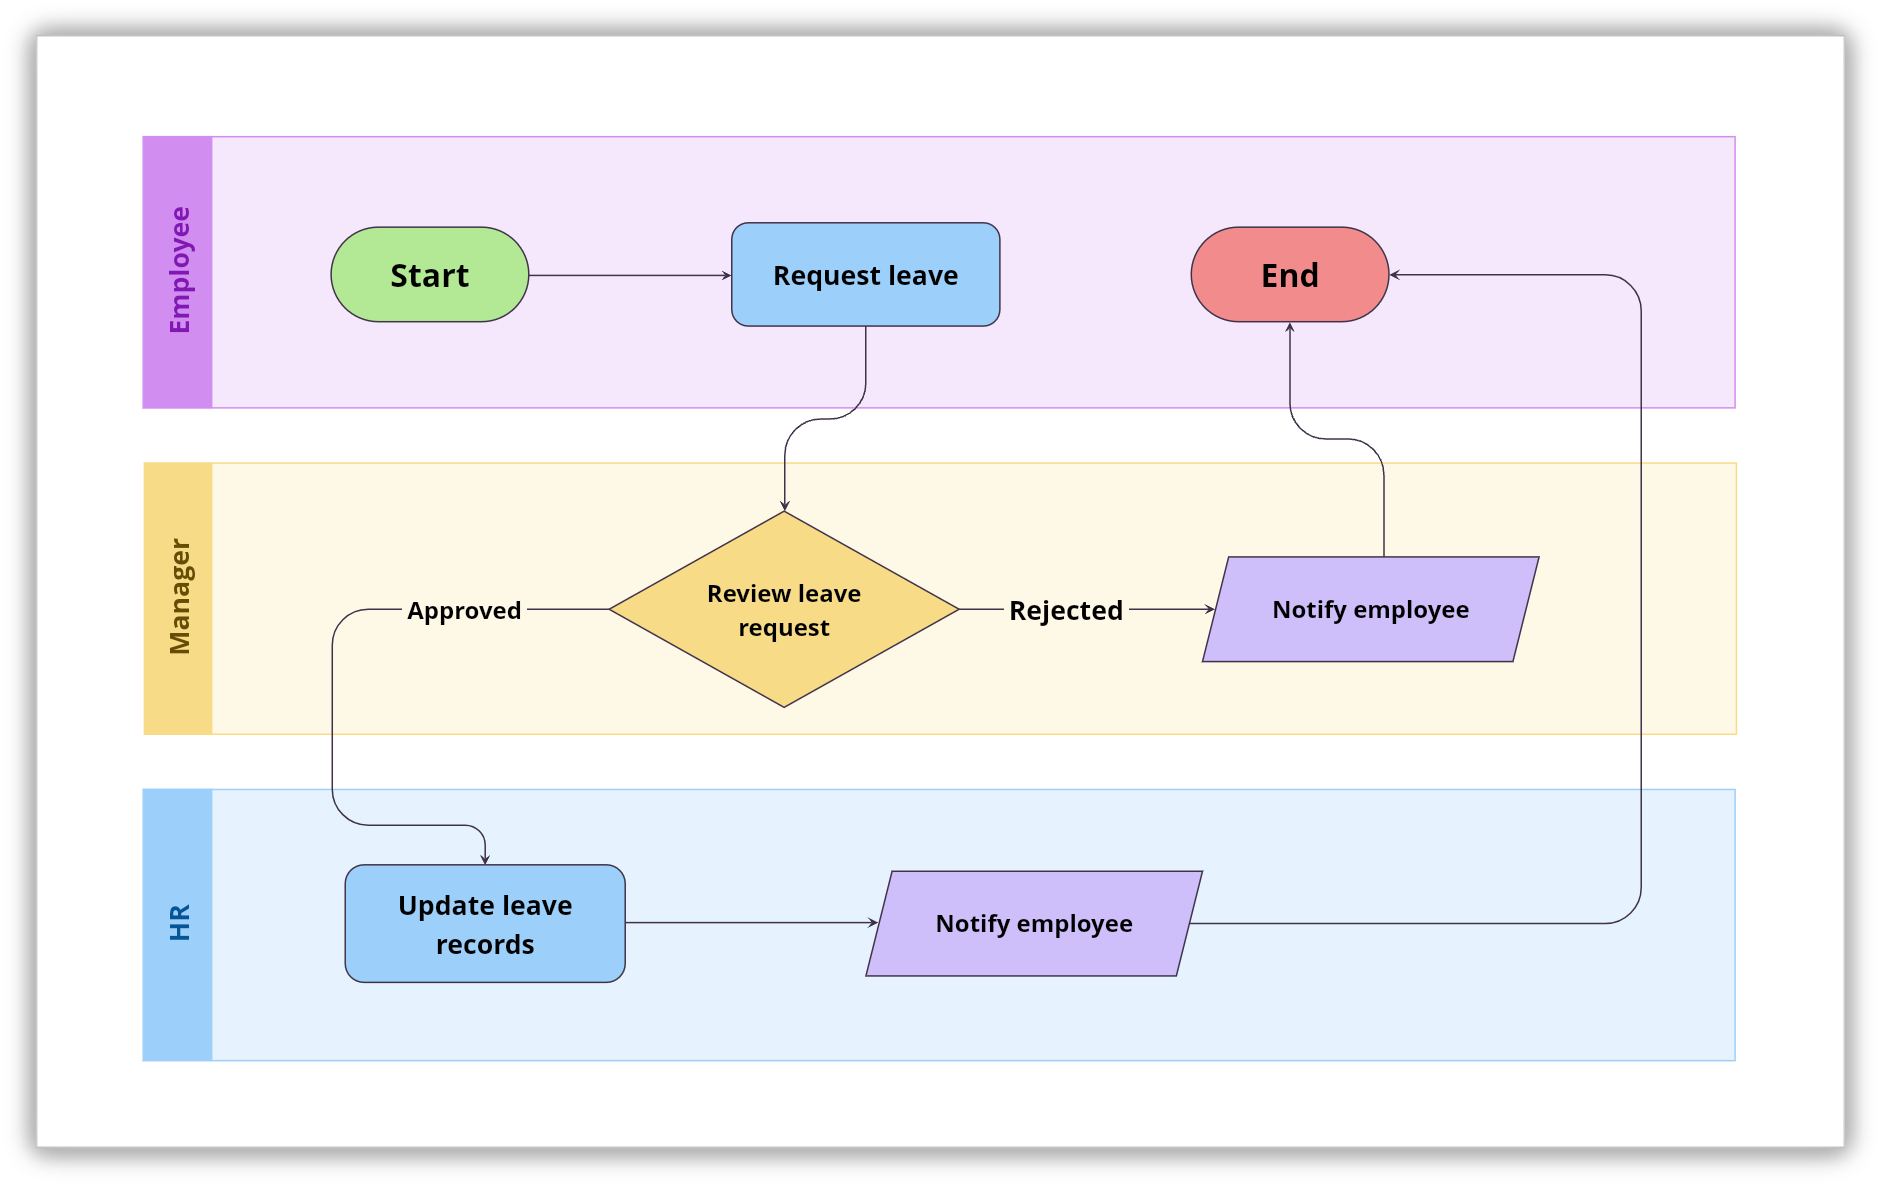
When a process involves multiple roles or departments, the swimlane flowchart adds structure by separating responsibilities into lanes. Each lane represents a specific role or team, allowing you to track interactions and dependencies without losing sight of the overall flow.
Below is an example of an employee leave request process split into lanes for the employee, manager, and HR, showing clear ownership at every step.
Decision flowchart
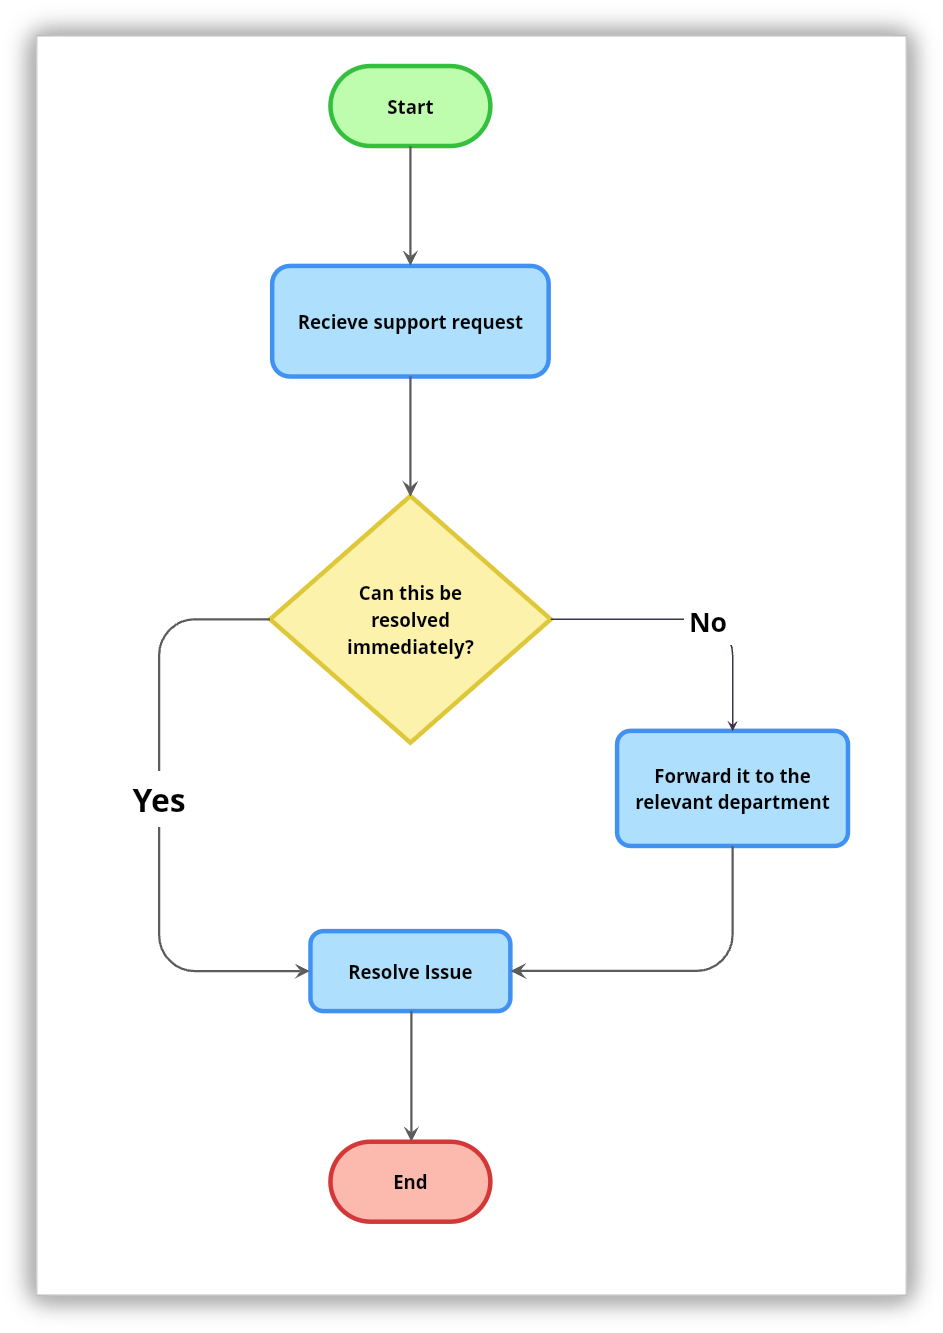
Some processes are driven more by choices than by steps. Decision flowcharts are designed around conditions and outcomes, guiding the flow based on answers to key questions. They are commonly used for approvals and troubleshooting.
A simple example would be a support flow where the path changes based on whether an issue is urgent or needs escalation.
More flowchart types for advanced use cases
The four types above cover everyday business and team use. But depending on your domain, a few specialized formats offer even greater precision.
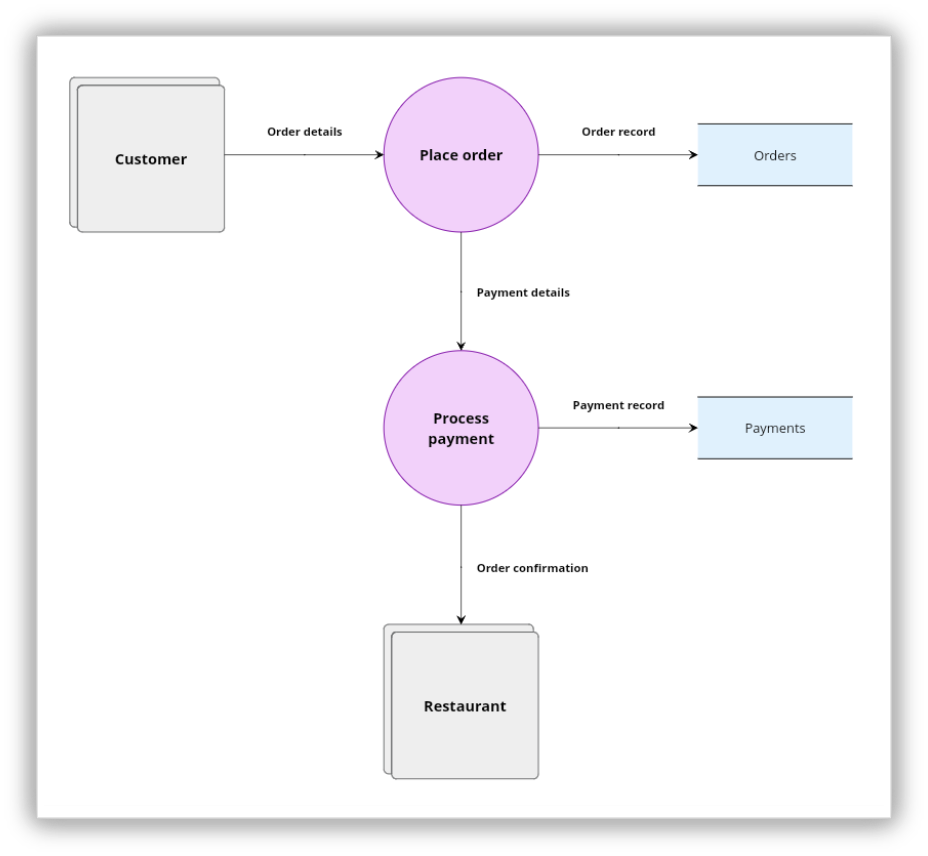
Data flow diagram (DFD)
A data flow diagram maps how data moves through a system rather than how tasks progress. It shows data inputs, processes that transform data, data stores, and external entities. DFDs are common in software architecture and systems analysis, where the focus is on what information is flowing, not just what steps are happening.
Program or algorithm flowchart
Used primarily in software development, this type maps out the logic of a program or algorithm before any code is written. It shows conditions, loops, inputs, and outputs at a granular level, making it easier to spot logical errors and edge cases before implementation begins.
BPMN (Business Process Model and Notation)
BPMN is a standardized notation used in enterprise process management. It extends the basic flowchart with additional symbols for events, gateways, sub-processes, and message flows between participants. BPMN is especially useful when processes span multiple systems or organizations and need to be documented with precision for compliance or automation.
Value stream map
Originating in lean manufacturing, a value stream map tracks the flow of materials and information required to deliver a product or service to a customer. Unlike a standard process flowchart, it includes data like wait times, cycle times, and inventory levels at each step, making inefficiencies visible at a glance.
How to build a flowchart from scratch
Building a good flowchart is more about thinking than drawing. The clearer your understanding of the process, the easier the diagram comes together. Here is a step-by-step approach that works regardless of the tool you're using.
1. Define the scope
Before getting started, decide what the flowchart covers. What triggers the process? What does a successful end state look like? What is out of scope? A clear boundary prevents the diagram from growing into something that tries to cover everything at once.
2. List every step
Write out every action, decision, and hand-off involved in the process in rough order. Do not worry about symbols yet. Getting every step out first is easier than trying to remember missing ones after the diagram is half-built.
3. Mark decisions and branches
Go through your step list and mark every point where the process can go in more than one direction. These become your decision diamonds. For each one, make sure every possible outcome has a path. A decision with a yes path but without a no path leaves the reader stuck.
4. Identify loops
Once your decisions are spot, look for steps that repeat. Ask whether any part of the process runs more than once before moving forward. If the answer is yes, decide which loop pattern fits. Mark loop entry and exit points clearly so anyone following the diagram knows what triggers the repetition and what ends it.
5. Assign symbols
Map each step to the right symbol using the reference table earlier in this blog. Consistency matters here. Using the same shape for the same type of action throughout makes the diagram significantly easier to read.
6. Lay it out
Arrange your shapes so the flow moves top to bottom or left to right. Keep related steps close together. Avoid crossing arrows where possible. Leave enough space between shapes so the diagram does not feel cluttered.
7. Review and test
Walk through the flowchart as if you are following the process in real life. Check that every path leads somewhere, every decision has all its branches covered, and every loop has a clear exit condition. Then ask someone unfamiliar with the process to follow it and note where they get confused.
Best practices to follow while creating flowcharts
Creating an effective flowchart is not just about using the right symbols; it's about making the process easy to read, follow, and understand. These best practices help ensure your flowcharts communicate clearly and serve their purpose.
Have your audience in mind: A diagram built for a developer and one built for a new hire will look very different even if they describe the same process. Decide who will read it before you decide how much detail to include.Keep the flow logical and consistent.
Avoid using too many decision points: Too many diamonds in a row makes a flowchart feel like a maze. If a single path passes through more than three or four consecutive decisions, consider whether part of the logic belongs in a separate diagram.
Keep parallel processes visually parallel: When two things happen at the same time or at the same stage, place them at the same level in the diagram. Visual alignment signals that steps are related, even before the reader reads the labels.
Avoid arrows that cross over: When arrows cross each other, the diagram becomes difficult to follow and suggests a layout problem. If lines keep crossing, reorganize the arrangement of shapes before adding more steps.
Limit text inside shapes: A shape that contains two or three sentences is doing the work of a document, not a diagram. If a step needs that much explanation, add a note or reference a separate document. Labels should be short enough to read in a single glance.
Generating flowcharts using AI
AI helps turn ideas into flowcharts quickly and smoothly. By describing a process in simple steps, the structure takes shape visually, making it easier to review, refine, and share with others.
This becomes even more useful when AI works alongside collaboration. In Vani, while working inside a Space, you can use Vani AI to generate a flowchart as the discussion is happening. Teams can talk through the process in a quick meeting within the same Space, see the flowchart come together in real time, and make adjustments together.
Since the flowchart is created as part of the conversation, decisions feel clearer and alignment happens faster. In this way, AI does more than generate diagrams—it becomes part of how teams think, discuss, and shape processes together.
Frequently asked questions about flowcharts
What is the difference between a flowchart and a process map?
The terms are often used interchangeably, but a process map tends to be broader. It sometimes includes roles, timelines, and performance metrics alongside the steps. A flowchart focuses specifically on the sequence of actions and decisions using standardized symbols. In practice, a process map often contains one or more flowcharts within it.
How many steps should a flowchart have?
There is no fixed number, but a single flowchart that requires more than 20 to 30 steps to follow from start to finish is usually a sign that the process should be broken into smaller sub-flowcharts. The goal is clarity. If the diagram is hard to follow in one sitting, it is too complex.
Can a flowchart have multiple endpoints?
Yes. Many real processes end differently depending on the decisions made along the way. A customer support flow, for example, might end with the issue resolved, escalated to a specialist, or closed by the customer. Each outcome is a valid endpoint and should be marked with a terminator symbol.
When should I use color in a flowchart?
Color can help group related steps, highlight critical paths, or distinguish between different roles in a swimlane. Use it sparingly and always alongside labels, never as the sole way to convey meaning. A flowchart should remain fully readable in black and white too.
Do flowcharts need to follow a specific direction?
Not strictly, but it is suggested to use top-to-bottom or left-to-right for the main flow. Choosing one direction and sticking to it throughout the diagram makes it far easier to read. Loops are the natural exception: a loop arrow pointing upward or leftward is expected and easy to follow as long as the rest of the diagram is consistent.
Final thoughts
Flowcharts make work feel calmer and more manageable. When steps are laid out clearly, there's less second-guessing and more confidence in moving forward. Seeing the full process on a page helps people feel in control, even when the task itself is complex.
This is why flowcharts continue to be used across teams, classrooms, and everyday work. They help people think clearly, explain ideas with ease, and work together without confusion. At their best, flowcharts don't just show steps—they bring clarity and reassurance to the way work gets done.