- HOME
- Technology & Trends
- 8 best diagramming and flowchart tools for teams in 2026
8 best diagramming and flowchart tools for teams in 2026
- Last Updated : September 1, 2026
- 72 Views
- 10 Min Read


When a process or system is hard to explain, a diagram can make it easier to understand. Instead of piecing things together from pages of explanation, people can see how everything connects in one place.
Teams use diagrams for everything from flowcharts and process maps to ERDs, UML, network diagrams, cloud architecture, and much more. A good diagramming tool makes those diagrams easier to create, edit, review, and keep up to date. With such a wide range of uses, the right tool depends heavily on what your team needs to create and how you want to work on it.
In this guide, we look at eight of the best diagramming and flowchart tools for teams in 2026 and where each one fits best. If you're still figuring out what to look for in a diagramming tool before building your shortlist, check out our guide to 8 things your team should check before choosing an online diagram maker.
Best diagramming software at a glance
Tool | Best for | Key strengths |
|---|---|---|
Vani | Collaborative business and technical diagramming | Multiple technical diagramming options, AI-assisted diagramming, and the ability to keep diagrams alongside the work around them |
Lucidchart | Advanced technical and data-driven diagramming | Detailed technical libraries, AI, data linking, and conditional formatting |
Miro | Diagramming with broader visual collaboration | Wide template library, AI diagramming, technical diagramming, and collaborative visual work |
draw.io/diagrams.net | Free and flexible technical diagramming | Straightforward diagramming, broad technical shape libraries, AI generation, and flexible local or cloud storage |
Microsoft Visio | Microsoft-centric teams and professional diagramming | Technical diagramming, data-connected workflows, and Microsoft ecosystem integration |
SmartDraw | Broad professional diagramming and layouts | Business and software diagrams alongside floor plans, engineering drawings, and other professional layouts |
Creately | Collaborative diagramming with connected context | Technical and business diagramming, AI, and the ability to attach data and context to visual objects |
FigJam | Collaborative diagramming for product and design teams | Fast visual diagramming, AI-generated diagrams, and real-time collaboration |
*Feature availability may vary by plan. Check the latest plan details from the provider for the capabilities your team needs.
How we evaluated these diagramming tools
We worked directly in every tool on this list and reviewed current product information published by each company. We created the same content-publishing flowchart in each tool, using native AI where available or building it manually, and used the same Order Management ERD to explore technical diagramming where applicable. We checked ease of creation and editing, diagram and shape libraries, templates, AI, collaboration, and sharing. We didn't treat community templates or third-party plugins as native product features.
Vani: Best for collaborative business and technical diagramming
Vani is an online diagramming tool for creating everything from everyday workflows and process maps to more detailed business and technical diagrams on an infinite canvas.
You can use AI to generate editable diagrams or build them using shapes, connectors, and templates. Once created, diagrams can be edited and refined directly on the canvas. For more specific diagramming needs, Vani offers dedicated Kits for ERDs, UML, BPMN, DFDs, network diagrams, cloud architecture, and more. Mermaid for code-to-diagram workflows and draw.io workflows are also available through dedicated Kits.
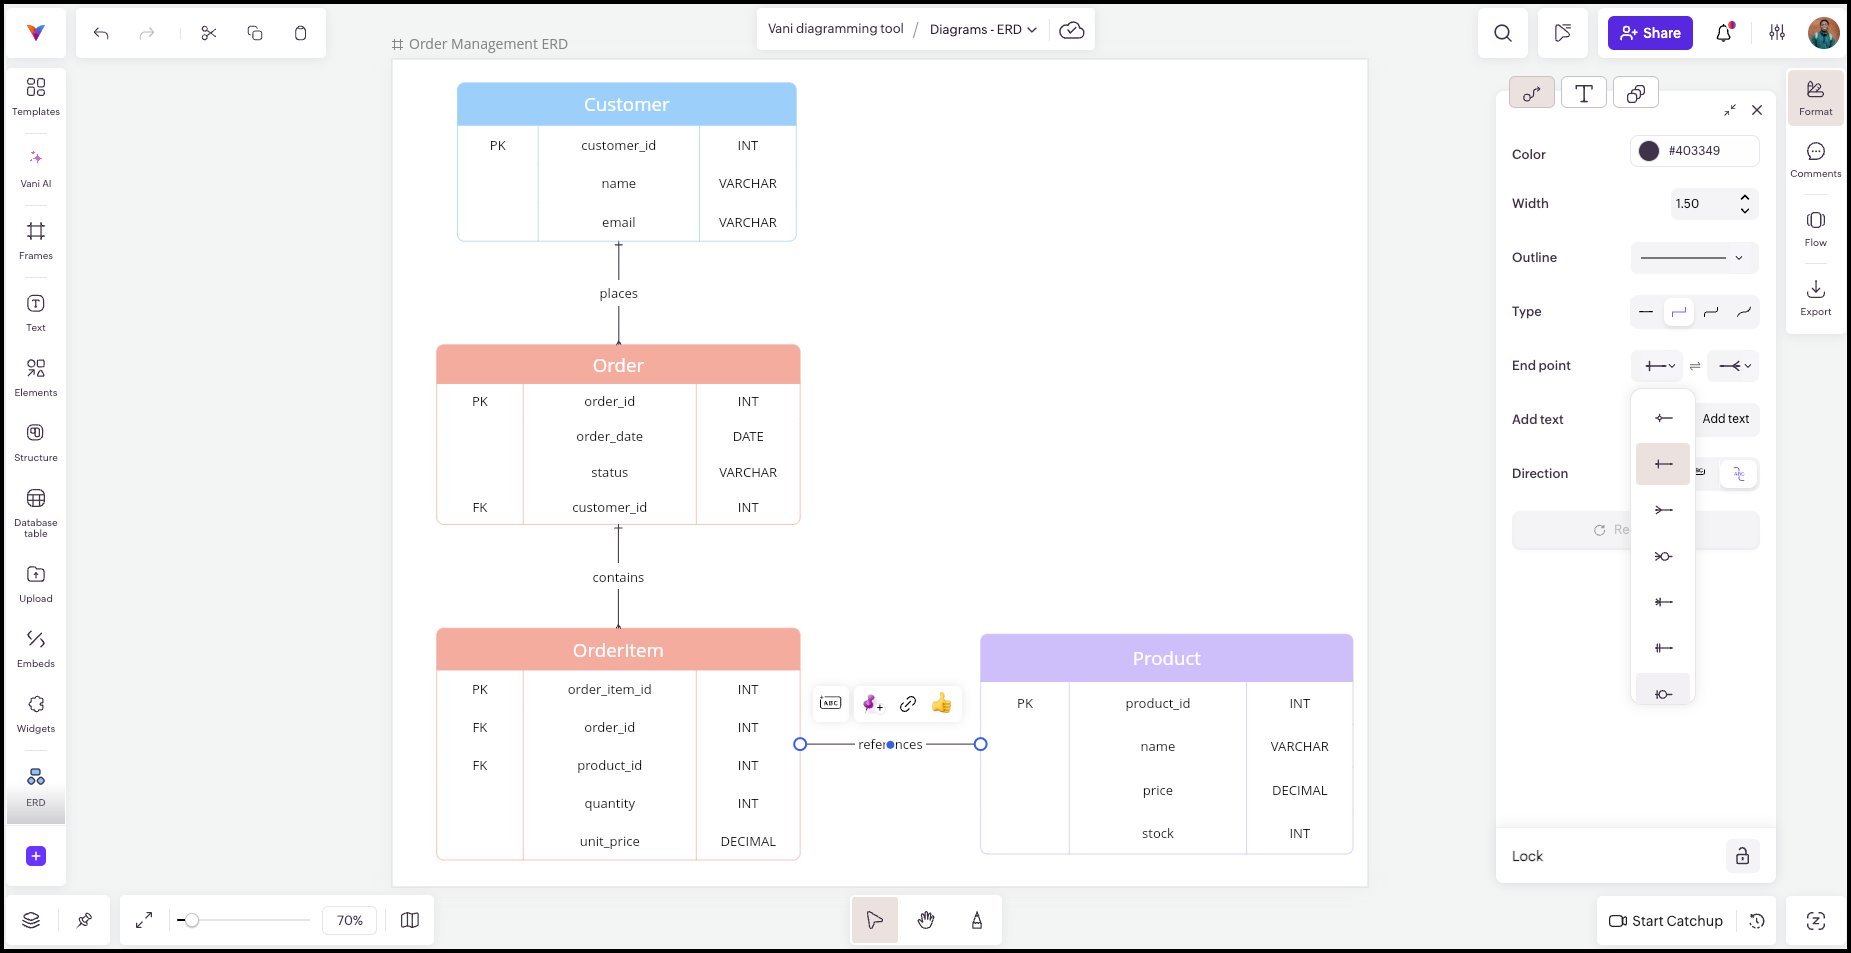
Diagrams can also stay alongside the work that gives them context. On the same canvas, you can keep notes, files, documentation, planning, and discussions close to the diagram, review and edit it with others, or work together through built-in video meetings.
This makes Vani useful whether you need a focused diagram for an individual task or a diagram that becomes part of ongoing team work. Explore diagramming in Vani.
Lucidchart: Best for advanced technical and data-driven diagramming
Lucidchart is built for detailed business and technical diagramming, with libraries covering ERDs, UML, BPMN, data flow diagrams, enterprise architecture, cloud and network diagrams, and more.
Lucid AI can generate editable diagrams from prompts. In our hands-on check, it handled both the content-publishing flowchart and Order Management ERD well, with the expected structure and relationships in place. Lucidchart also supports diagram-as-code workflows with Mermaid, giving technical teams another way to create diagrams without starting from shapes.
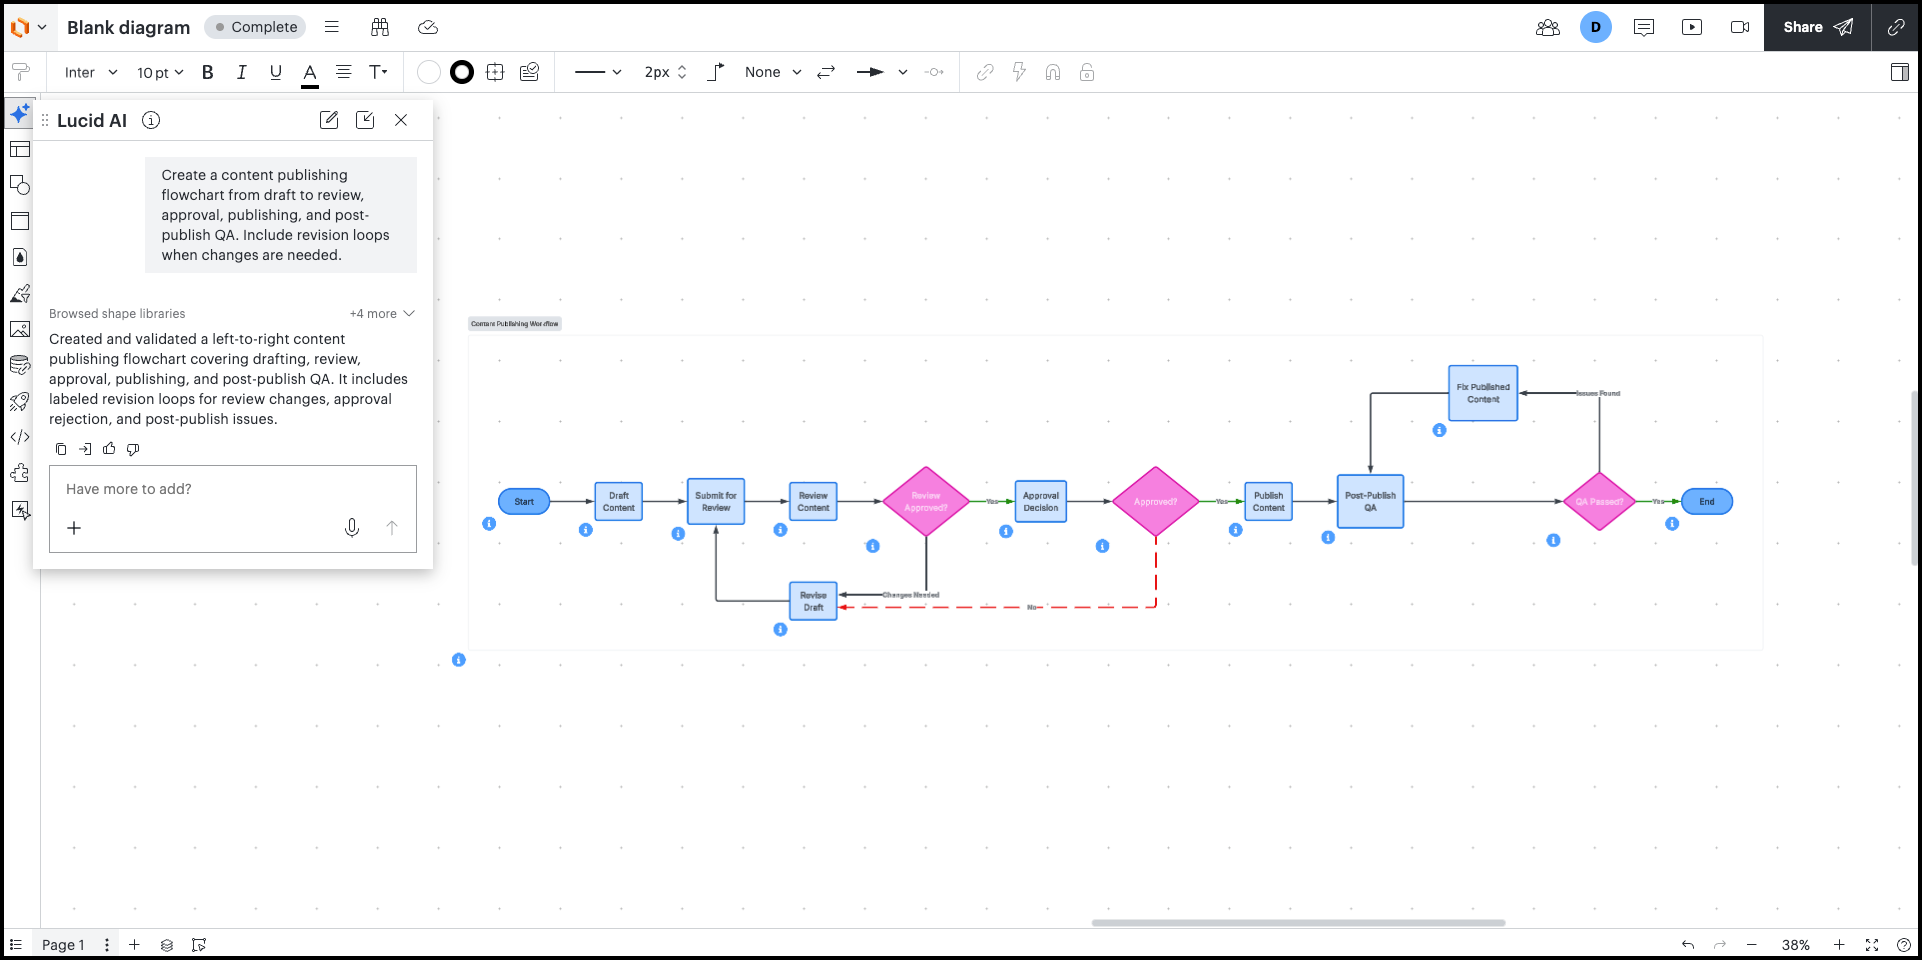
For data-driven work, Lucidchart can link shapes to sources such as Google Sheets, Excel, and CSV files, with conditional formatting to surface changes visually.
That combination makes Lucidchart especially useful for teams working with detailed technical diagrams, data-linked visuals, or diagram-as-code workflows, while teams with simpler diagramming needs may not need the same level of depth.
Miro: Best for diagramming with broader visual collaboration
Miro combines structured diagramming with a broader collaborative canvas for brainstorming, planning, workshops, and review. Its diagramming tools and shape libraries cover flowcharts and process maps as well as more technical work, including BPMN, UML, ERDs, data flow diagrams, cloud architecture, Kubernetes, Cisco, and more.
Miro AI can generate editable diagrams from prompts. In our hands-on check, we used it to create both the content-publishing flowchart and Order Management ERD, and we could continue editing the results directly on the board. Miro also supports Mermaid diagrams for teams that prefer a code-to-diagram workflow.
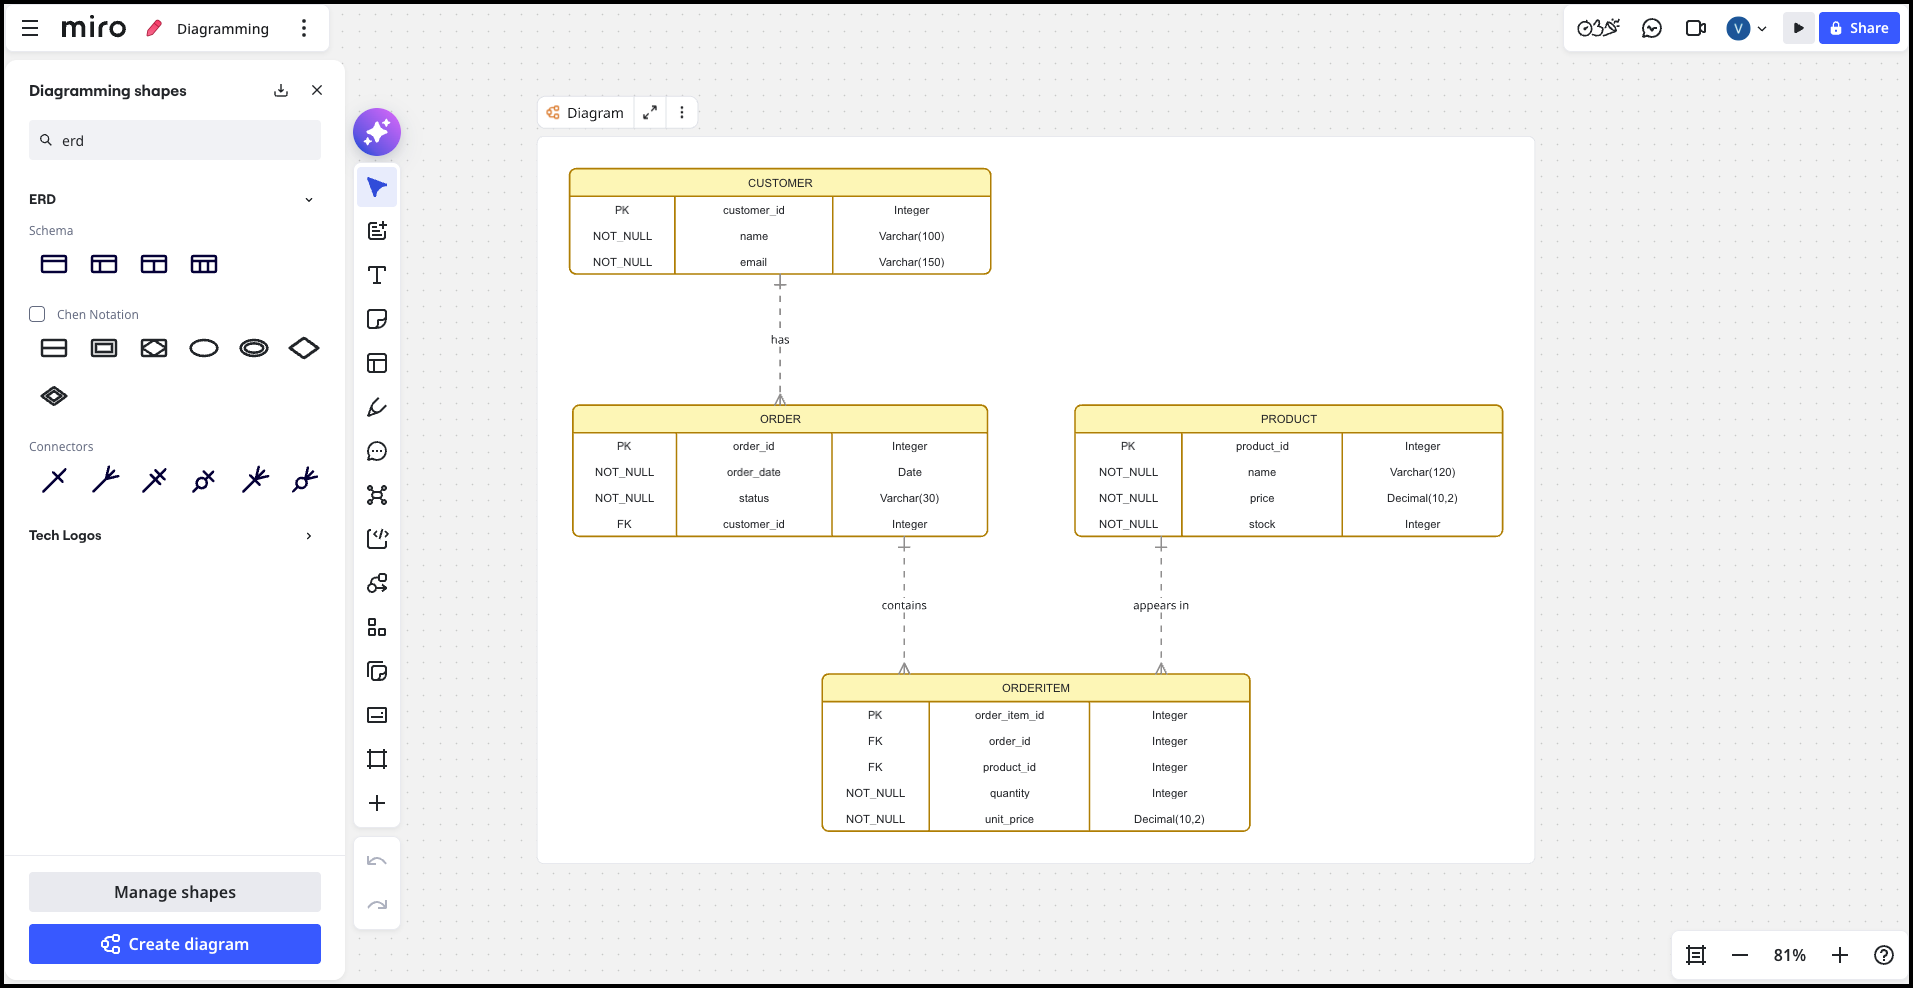
Diagrams can stay alongside other visual work on the same canvas, including planning, workshop content, comments, and presentations. Miro also has a large template collection covering both diagramming and wider collaborative use cases.
In our testing, that breadth made the interface feel busier than a focused diagram editor, but it can work well for teams that regularly move between diagramming and other visual collaboration options.
draw.io/diagrams.net: Best for free and flexible technical diagramming
draw.io is a free, open-source diagramming tool that can be used online without creating an account. Its straightforward editor makes it easy to start quickly, while its shape libraries cover a wide range of technical diagramming, including ERDs, UML, BPMN, data flow diagrams, cloud architecture, networking, and more.
draw.io also includes AI diagram generation in its online editor. In our hands-on check, we used it to create both the content-publishing flowchart and Order Management ERD and could continue editing the generated shapes and connectors directly on the canvas.
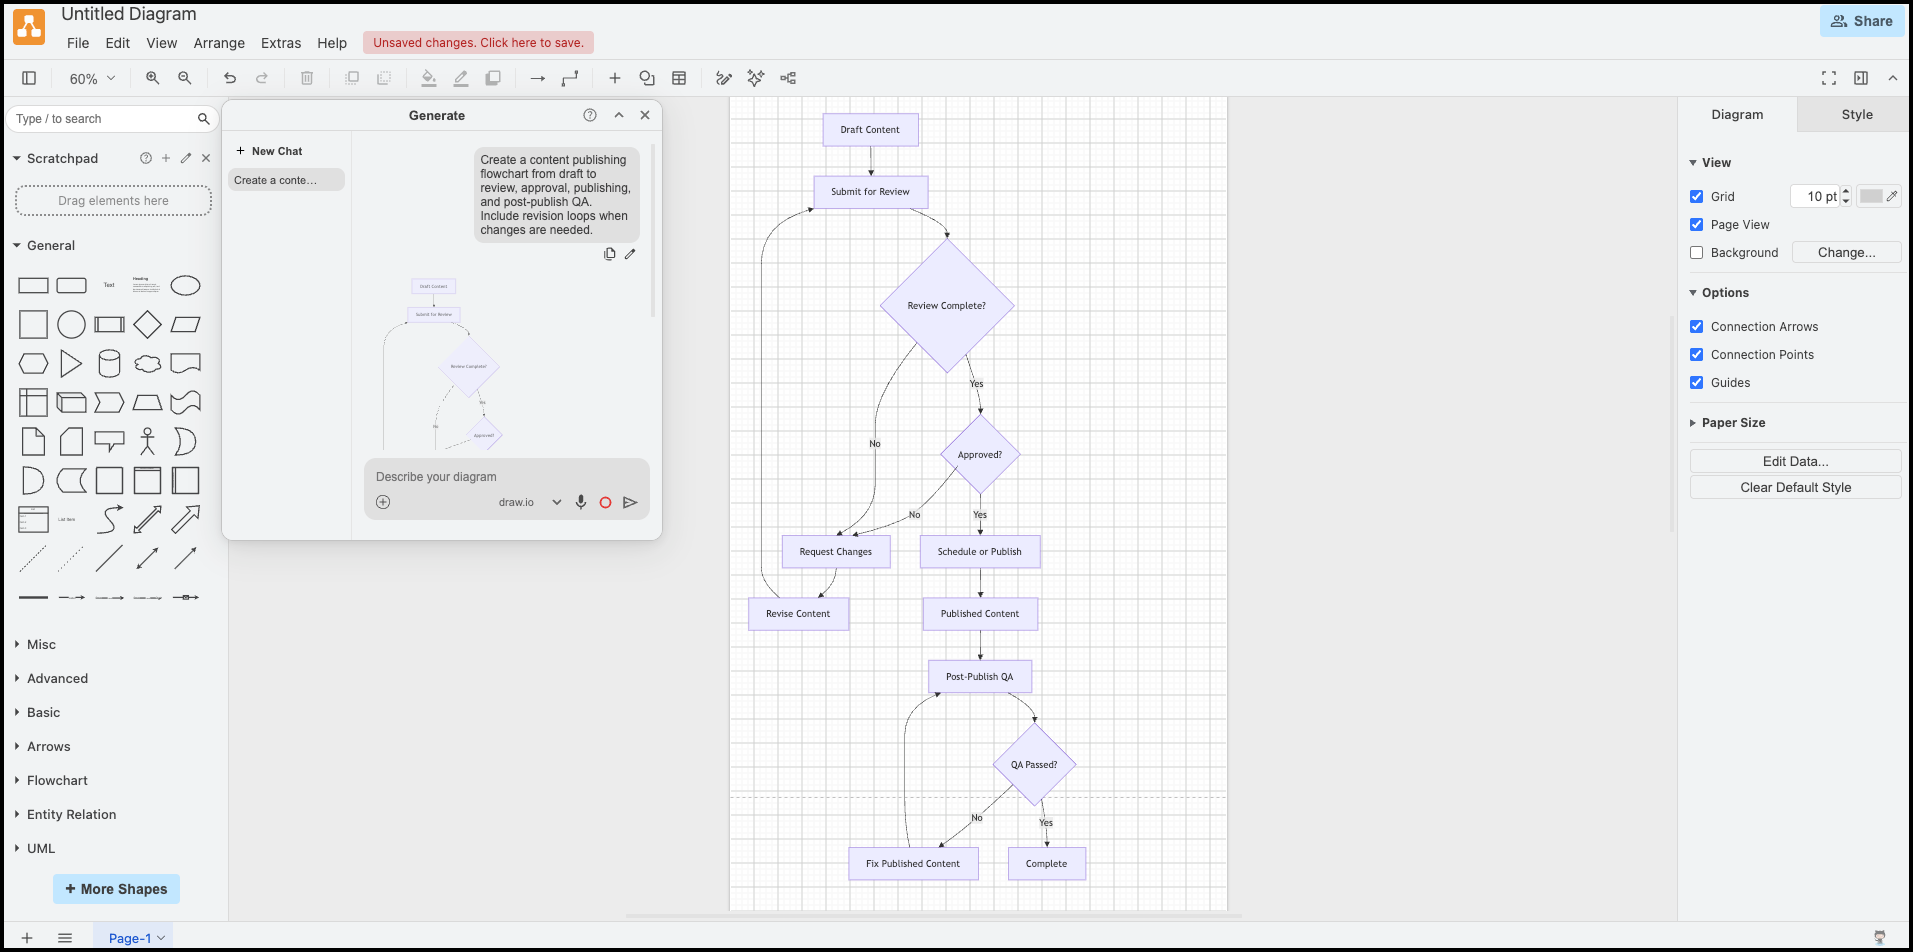
Another useful difference is that draw.io lets you choose where your diagram files are stored. You can save them locally or use services such as Google Drive, OneDrive, Dropbox, GitHub, and GitLab. Real-time collaboration with shared cursors is available through supported integrations, including Google Drive and OneDrive.
It may be less suited to teams looking for one central environment for diagrams, discussions, and broader collaborative work, but for teams that want a free, no-sign-up online diagramming tool with technical depth and flexible storage options, draw.io can work well.
Microsoft Visio: Best for Microsoft-centric teams and professional diagramming
Microsoft Visio supports a broad range of business and technical diagramming, including flowcharts, ERDs, UML, network diagrams, cloud architecture, and more.
In our hands-on check with Visio for the web, we recreated the content-publishing flowchart and explored its Crow’s Foot ERD tools, including dedicated entity shapes, relationships, and cardinality controls. Visio also supports data-connected diagramming and integrates closely with the wider Microsoft ecosystem.
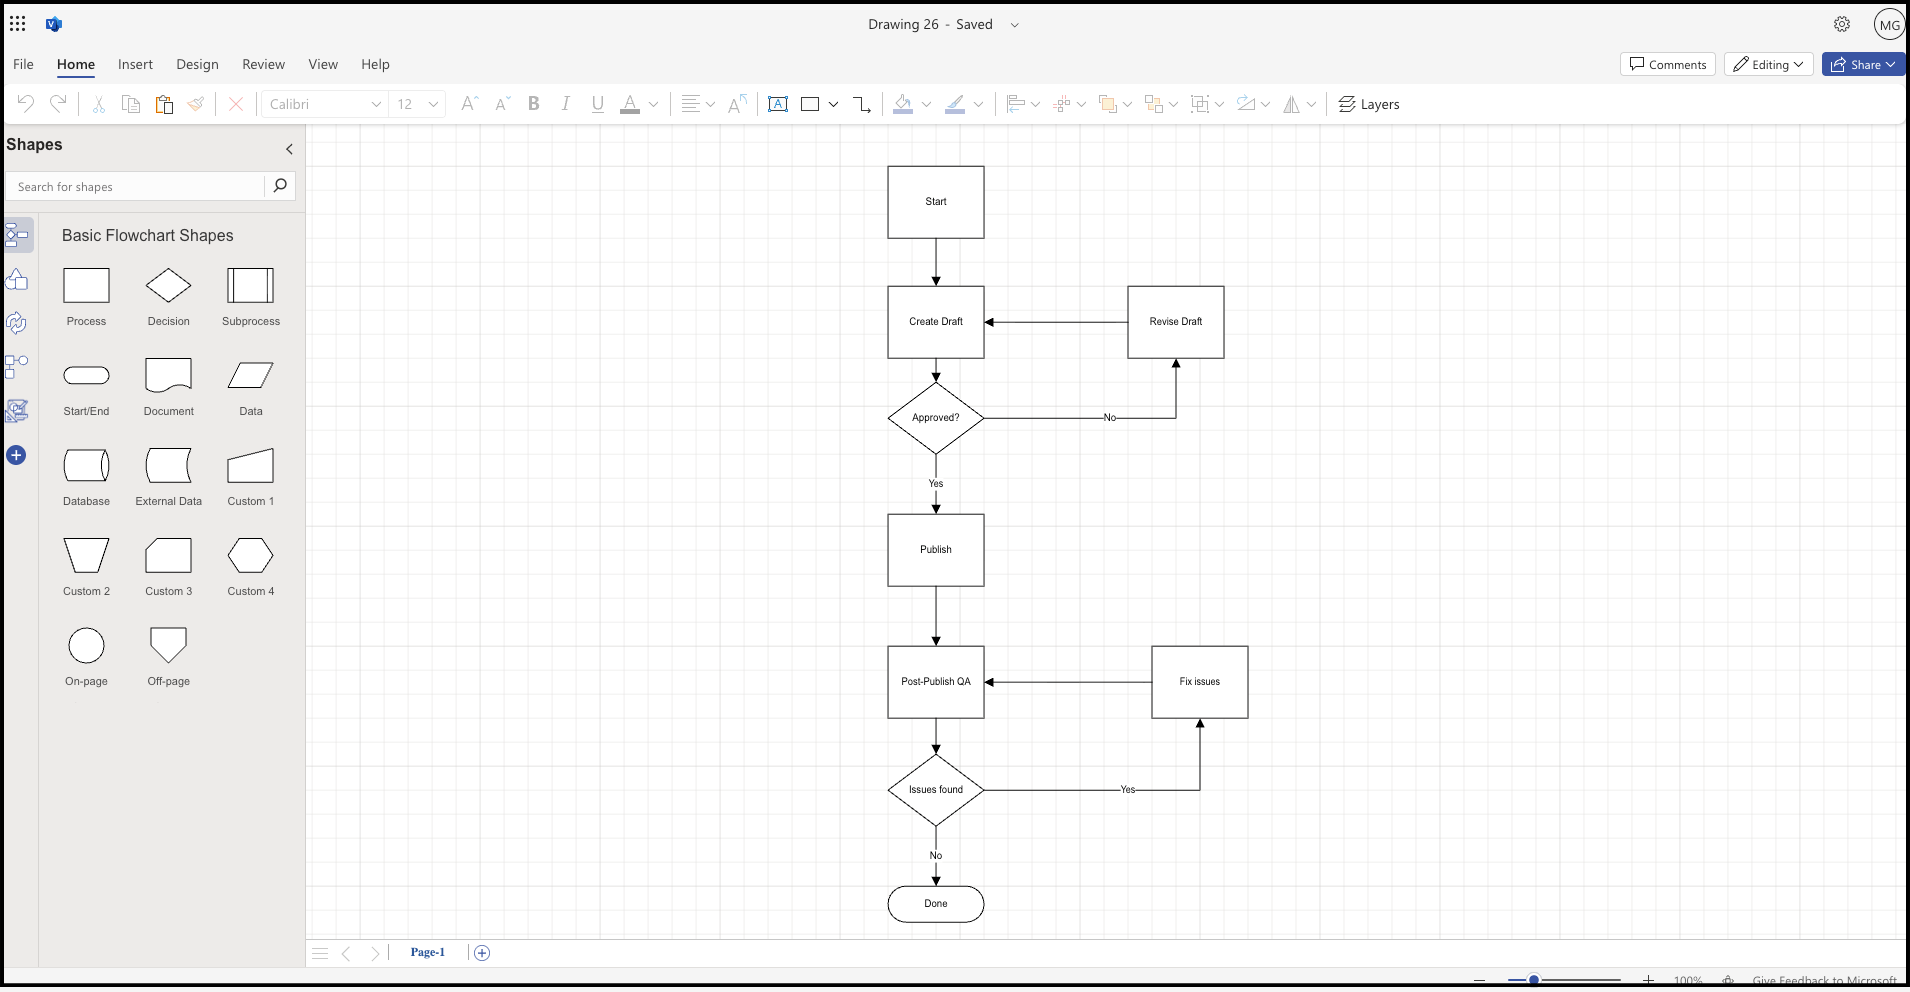
Capabilities can vary by Visio plan and between the web and desktop apps, so teams may want to check the version that supports the diagram types and advanced features they need.
For organizations already working heavily with Microsoft 365, Visio can be a natural option for professional business and technical diagramming.
SmartDraw: Best for broad professional diagramming and layouts
SmartDraw covers a broad range of professional drawing and diagramming use cases. Its software design tools include ERDs, data flow diagrams, UML, and other technical diagrams, while its wider library extends into flowcharts, IT and networking, engineering, CAD and drafting, floor plans, and other professional layouts.
In our hands-on check, we recreated the content-publishing flowchart manually and explored its ERD tools and technical templates. The breadth of its template library stood out, with separate categories for software design, engineering, floor plans, IT and networks, and more.
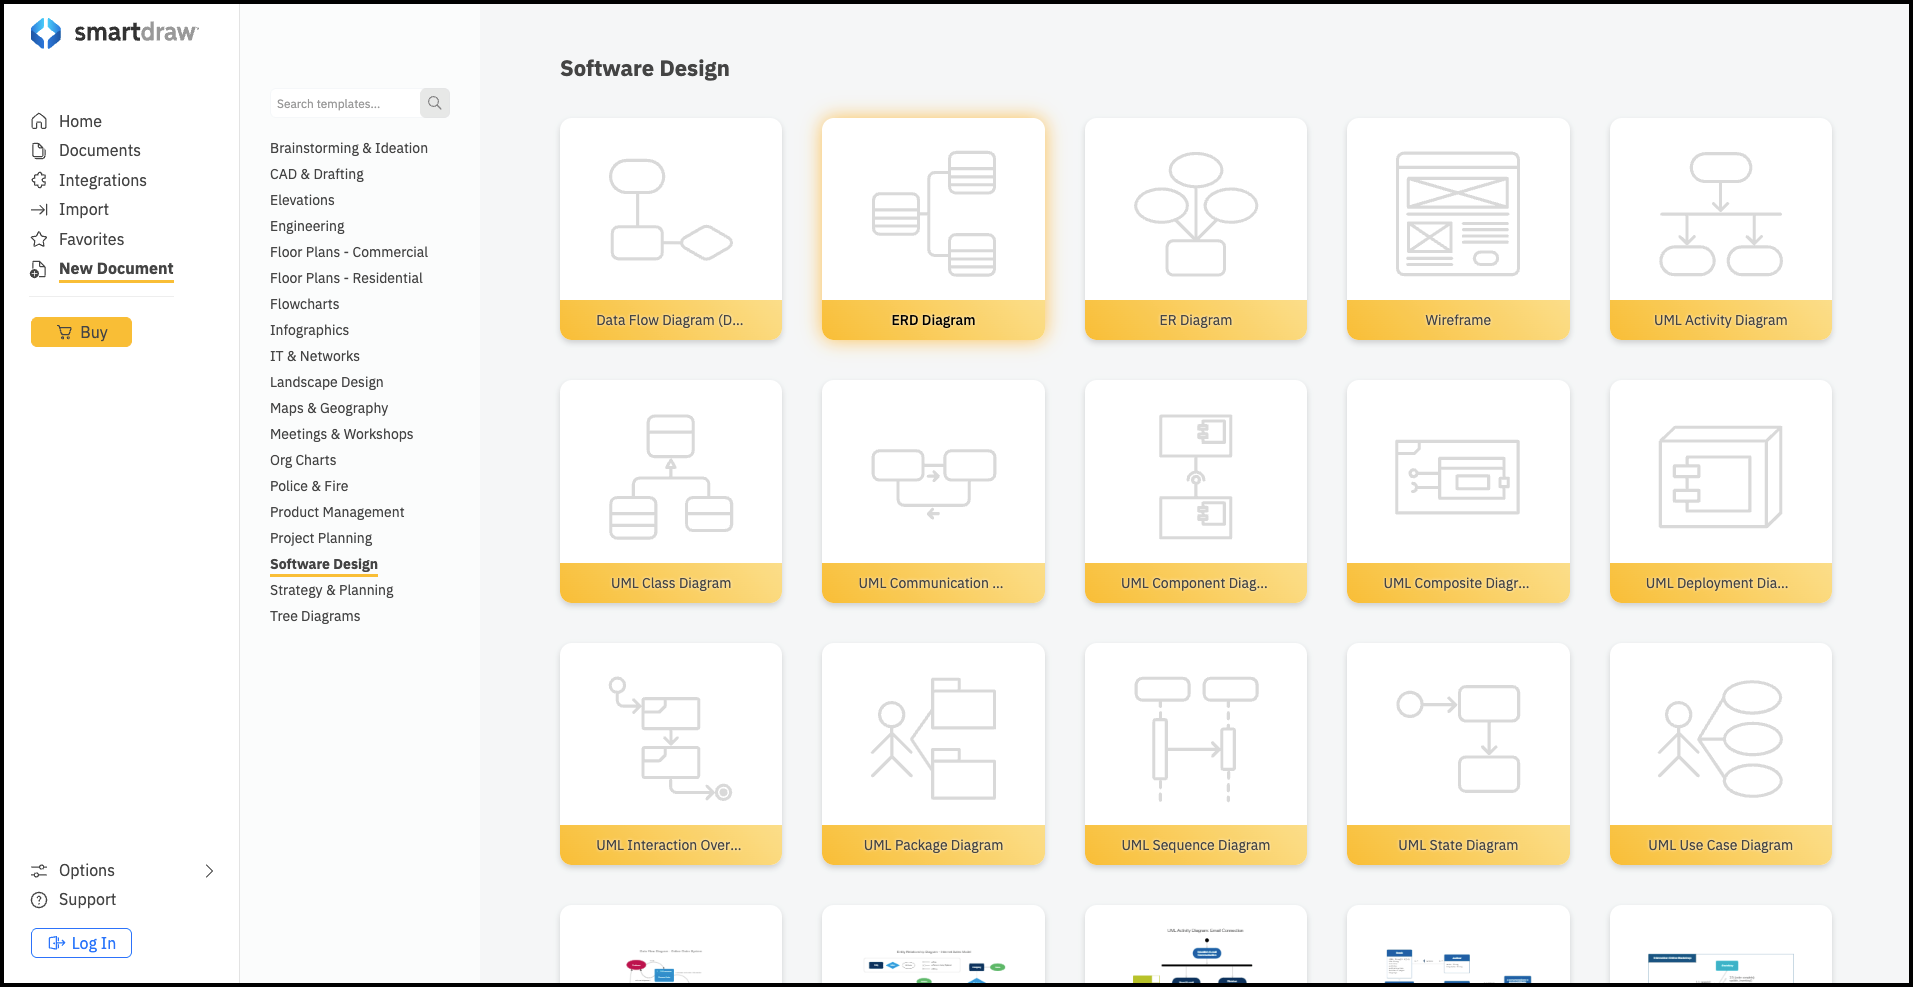
SmartDraw also offers AI generation for flowcharts, org charts, mind maps, and timelines. We couldn't access the AI generator in the account we used, so our hands-on check focused on its manual diagramming tools.
For teams whose visual work extends beyond standard flowcharts into software diagrams, floor plans, engineering drawings, and other professional layouts, SmartDraw offers a particularly broad set of options.
Creately: Best for collaborative diagramming with connected context
Creately combines business and technical diagramming with a collaborative visual canvas. It supports diagram types including ERDs, UML, BPMN, data flow diagrams, network diagrams, cloud architecture, process maps, and more.
Creately AI can generate diagrams from natural-language prompts. In our hands-on check, it turned the content-publishing flowchart prompt into an editable process map with swimlanes and revision loops. We also worked with an ERD template to explore its database diagramming experience.
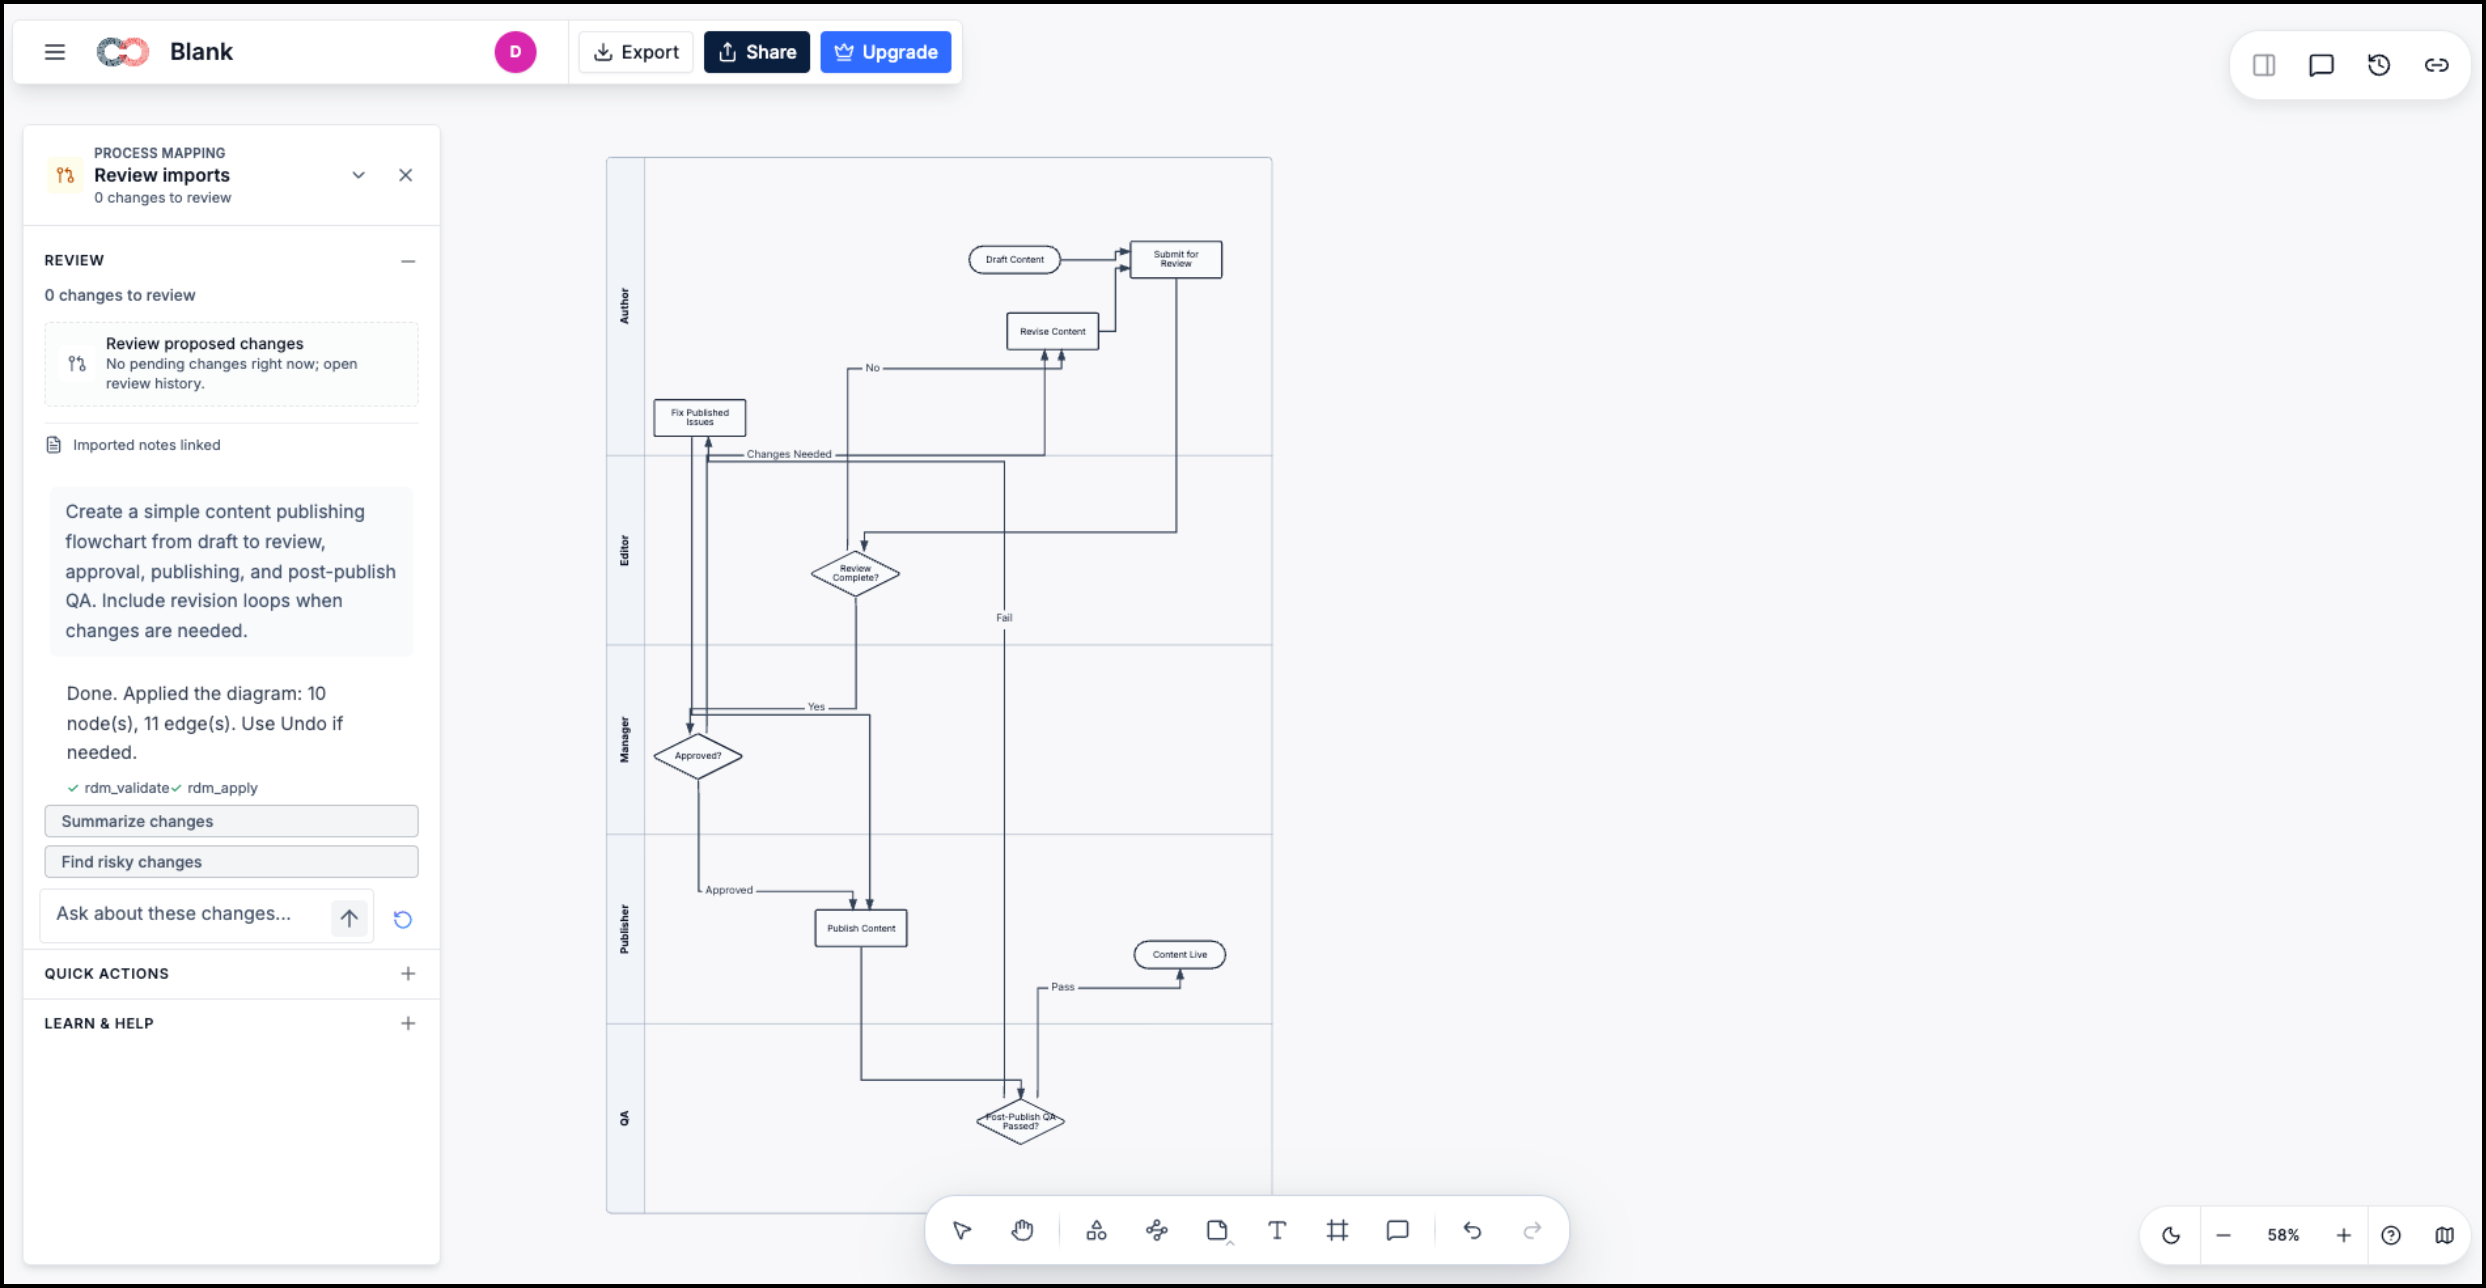
A distinguishing part of Creately is that diagram elements can carry more than what is visible on the canvas. Notes, data fields, attachments, links, and other supporting information can stay connected to individual shapes, helping teams keep additional context close to the process or system being mapped.
Teams mainly looking for straightforward diagram creation may not need that additional layer of context, but for teams that want diagrams to hold supporting information and remain part of broader collaborative work, Creately can work well.
FigJam: Best for fast collaborative diagramming for product and design teams
FigJam is a collaborative whiteboard with diagramming tools for creating user flows, processes, system maps, and other visual structures. Shapes and connectors snap together as you work, making diagrams easy to build and rearrange directly on the canvas.
FigJam AI can also generate editable diagrams from prompts. In our hands-on check, we used it to create the content-publishing flowchart and continued refining the generated shapes and connections directly on the board
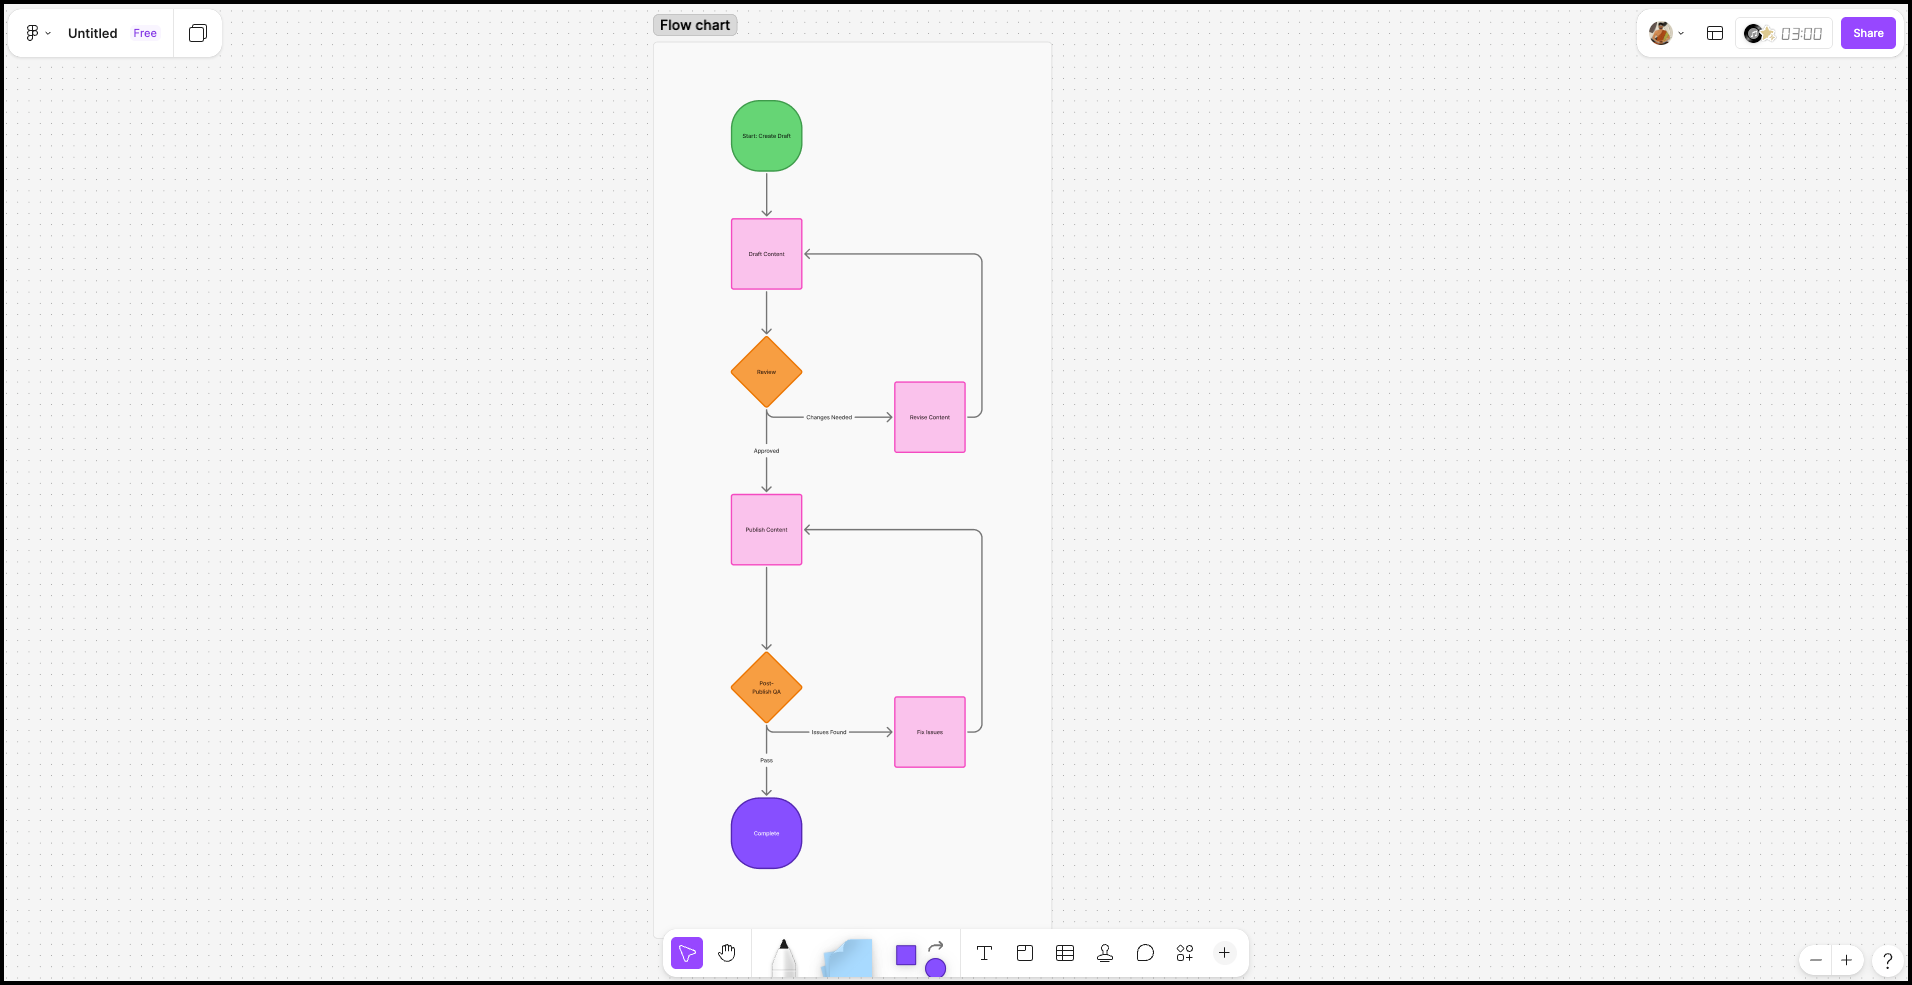
FigJam brings diagramming into the wider Figma collaboration environment, which can be useful for product and design teams working on user flows, processes, planning, and design-related discussions together. Its focus is on quick visual diagramming and collaboration rather than adding a large amount of specialized diagramming functionality upfront.
Teams with more specialized technical diagramming requirements may need to check whether it provides the notation and controls they need. For product and design teams that mainly need fast, collaborative flows and visual planning, FigJam can work well.
Also worth considering: Mermaid for code-to-diagram workflows
You may have noticed Mermaid appear more than once in the tools above, either as a built-in workflow or through a dedicated integration. Mermaid takes a different approach to diagramming. Instead of starting with shapes on a canvas, you can define the diagram using code and have it rendered visually.
The code describes the structure, relationships, and flow of the diagram. When the code changes, the rendered diagram updates along with it.
In our hands-on check, we recreated the same content-publishing workflow using a short Mermaid definition, with the code and rendered flowchart displayed side by side.
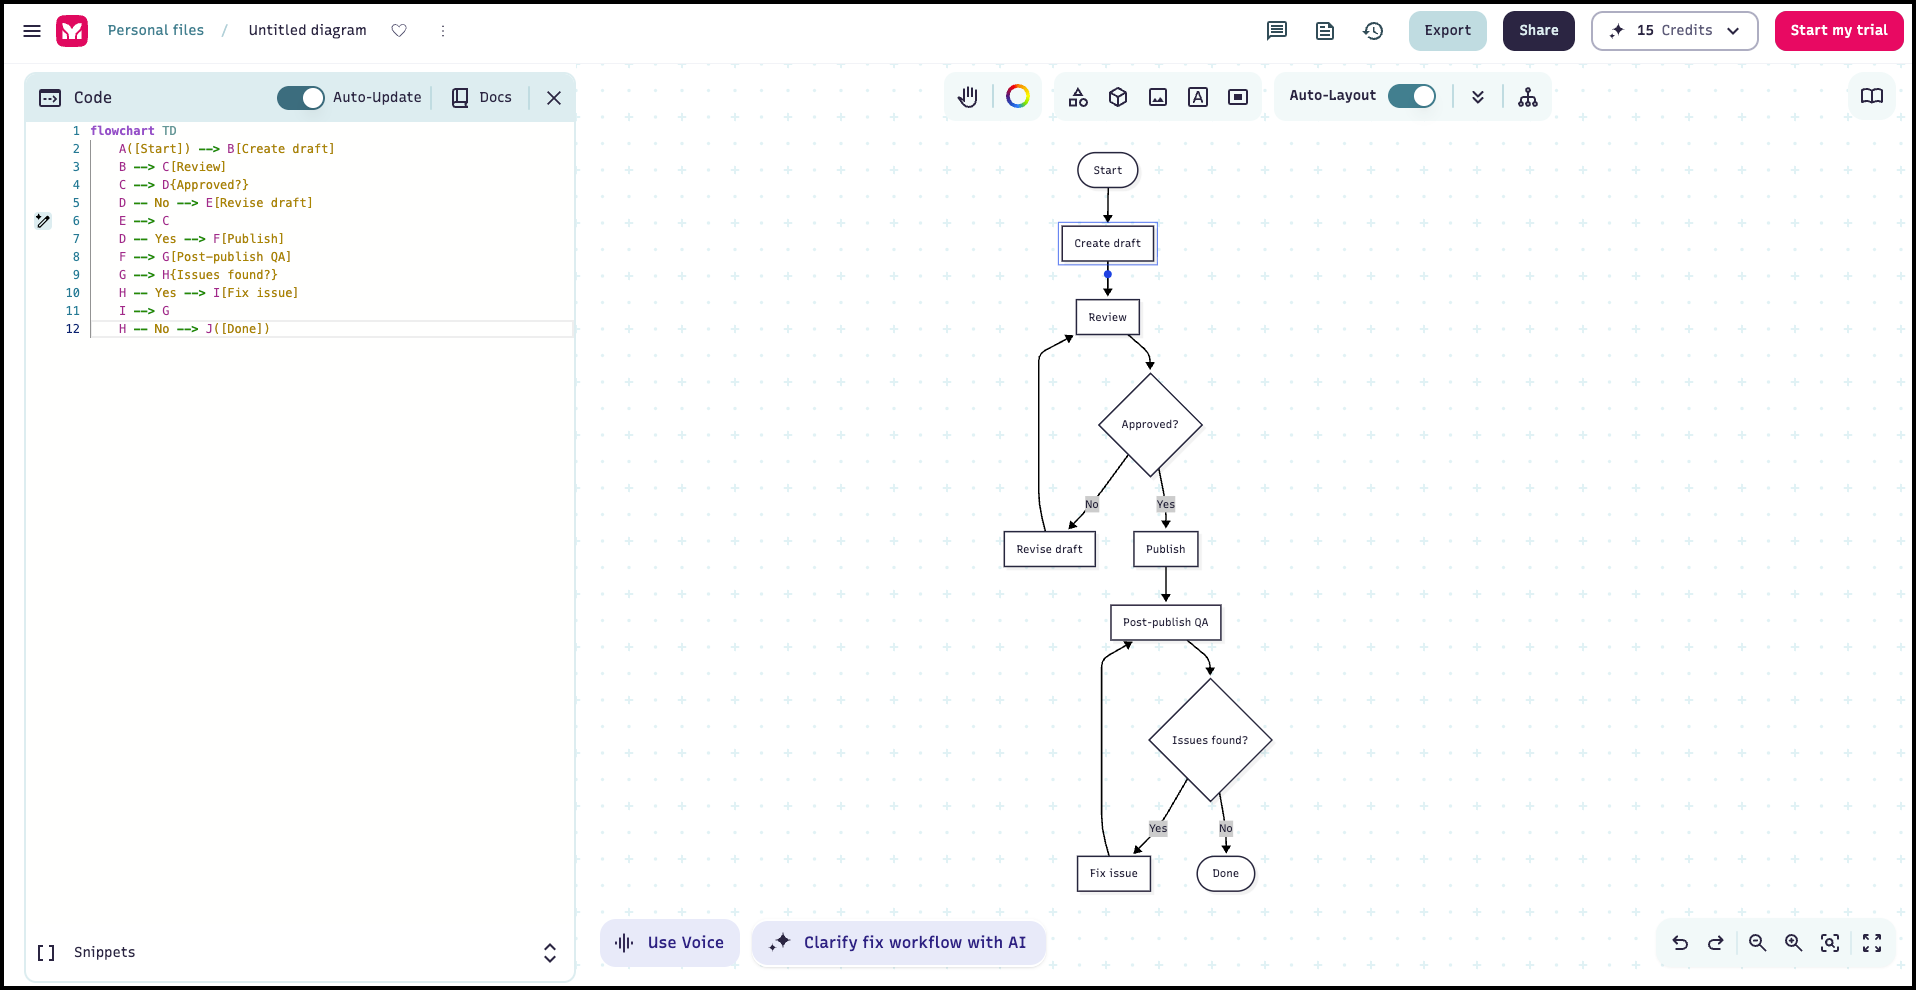
This approach can be useful for technical teams that want diagrams to stay close to documentation or other code-based workflows. It is also worth knowing because Mermaid-based diagramming is available in several broader diagramming tools, including some covered in this guide.
How to choose the right diagramming tool for your team
The right choice depends less on which product has the longest feature list and more on the kind of diagrams your team actually creates. A team primarily creating flowcharts and process maps will have different needs from one regularly working with ERDs, UML, BPMN, network diagrams, or cloud architecture. Check not only whether a tool can create the diagram but whether its shapes, relationships, and editing controls provide enough depth for the work you expect to do.
Then consider what happens after the first version is created. Diagrams are rarely finished in one pass. The easier it is to rearrange the structure, update relationships, review changes, and involve other people, the more useful the diagram can remain as the underlying work changes.
Templates and AI can make it faster to get started, but the result still needs to be easy to work with. If AI creates the first version, check whether you can correct the structure, edit individual elements, and continue developing the diagram yourself.
Collaboration, sharing, access controls, integrations, and where the diagram ultimately lives matter, too. Some teams want a focused diagram editor, while others want diagrams to stay connected to planning, documentation, discussions, and the rest of their work. The best choice is the one that gives your team the diagramming depth it needs without adding complexity it does not.
If you want a more detailed checklist for evaluating your options, see our guide to 8 things your team should check before choosing an online diagram maker.
FAQs
What is the best diagramming tool for teams?
The best diagramming tool depends on what your team needs to create and how you want to work. Vani combines business and technical diagramming with collaboration and the ability to keep diagrams alongside the work around them. Lucidchart is suited to detailed technical and data-driven diagramming, while Miro combines diagramming with broader visual collaboration. draw.io offers free and flexible technical diagramming, and Visio fits well with Microsoft-centric workflows. SmartDraw stands out for its broad range of professional diagrams and layouts, Creately for keeping additional information connected to diagram elements, and FigJam for quick, collaborative diagramming for product and design teams.
These are only some of the options available. No single diagramming tool will be the right fit for every team, so the best choice comes down to the diagrams you need to create, the depth you need, and how your team wants to work together.
What is the difference between diagramming software and flowchart software?
Flowchart software focuses on visualizing the steps, decisions, and paths within a process. Diagramming software covers a broader range of visuals, which can include flowcharts as well as ERDs, UML, BPMN, network diagrams, cloud architecture, and more.
Many diagramming tools today include flowchart creation as part of a wider set of diagramming capabilities.
Can AI create diagrams automatically?
Yes. Several diagramming tools can now generate editable diagrams from natural-language prompts. In our hands-on checks, we used AI-generated diagrams in Vani, Lucidchart, Miro, draw.io, Creately, and FigJam.
AI can make it faster to create the first version, but editability still matters. A useful AI-generated diagram should let you change the structure, content, shapes, and relationships after it is created.
What is the best free diagramming tool?
For a completely free, open-source online diagramming tool, draw.io is a strong option. It supports a wide range of business and technical diagrams and can be used online without signing up.
Several other tools in this guide also offer free plans. Vani, for example, offers a Free plan with unlimited Spaces and collaborators, along with creation, real-time collaboration, and AI capabilities.
What should you look for in an online diagramming tool?
Start with the types of diagrams your team needs to create and check whether the tool provides the right shapes, notation, relationships, and editing controls for them. Then consider ease of editing, templates, AI, collaboration, sharing, integrations, access controls, and where your diagrams will live.
The right combination depends on whether you primarily need a focused diagramming tool or want diagrams to remain connected to the wider work your team is doing.