- HOME
- Technology & Trends
- Choosing an online diagram maker? 8 things your team should check first
Choosing an online diagram maker? 8 things your team should check first
- Last Updated : July 20, 2026
- 65 Views
- 9 Min Read


Key takeaways
What to evaluate | Why it matters |
Diagram types | The tool should support the diagrams your team actually creates. |
Ease of use | People should be able to start, edit, and update diagrams without friction. |
Templates and shape libraries | The right assets help teams create clearer diagrams faster. |
Collaboration | Comments, reviews, and shared editing keep feedback close to the diagram. |
Technical depth | Engineering, IT, and operations teams may need structured diagramming support. |
AI features | AI should help create useful first drafts, not just nice-looking visuals. |
Sharing, exports, and access | Teams should be able to share diagrams easily while controlling who can view, comment, or edit. |
Long-term organization | Diagrams should stay easy to find, update, and trust as work changes. |
Every diagram starts with the same goal: helping people understand something faster.
But as projects change, diagrams can become outdated, disconnected from discussions, or buried across different tools. The right diagram maker should help your team keep diagrams useful long after the first draft.
That is where the choice gets tricky. Some tools are easy for quick sketches but weak when teams need feedback and review. Others support many diagram types but can feel difficult for non-technical teammates.
If you're choosing an online diagram maker, here are eight things worth checking before you decide.
1. Does it support the diagrams you need to create?
Start by checking whether the tool supports the diagrams your team creates most often. The right tool should match your actual work, not just give you a few generic shapes.
Some teams may only need simple flowcharts or mind maps. Others may need structured diagrams such as ER diagrams, UML diagrams, BPMN diagrams, data flow diagrams, network diagrams, cloud architecture diagrams, org charts, wireframes, journey maps, or swimlane diagrams.
This matters because diagramming needs often expand as a project develops. A product team may first map a signup or onboarding flow then later create a journey map to understand the full customer experience. Engineering may start with a simple system sketch then move into an ER diagram or architecture diagram. Operations may begin with a process map then use a swimlane diagram when ownership and handoffs need to be clearer.
A useful diagramming tool gives you enough range for the diagrams you create now and the ones you may need as the work grows.
2. How easy is it to start, edit, and bring others in?
A diagram maker should make the first draft easy, but the real test comes later. Can you update the diagram when something changes? Can someone else understand it, edit it, and leave feedback without needing a long explanation?
For example, a product manager may quickly map an onboarding flow before a review meeting. During the discussion, someone points out a missing email step, another person suggests a different path for invited users, and the designer wants to adjust the flow before turning it into screens. If every change takes too much effort, the diagram slows the team down instead of helping them move faster.
Look for a smooth starting experience. Can you begin with a blank canvas or a template? Can you add shapes, connect them, adjust the layout, and change the structure without fighting the interface? Can you invite others when the diagram needs review?
This matters because many diagrams start with one person but become useful only when others contribute. The right diagramming software should make the move from individual drafting to team review feel natural.
3. Does it offer the right templates and shape libraries?
Templates and shape libraries help teams create diagrams faster and more accurately. This is different than simply supporting a diagram type. The tool should also give you the right building blocks to create that diagram properly.
For example, engineering teams may need UML shapes, ERD notation, database symbols, or system architecture icons. DevOps, infrastructure, and IT teams may need cloud or network icons for AWS, Azure, Google Cloud, Kubernetes, Cisco, routers, firewalls, servers, and related systems. Operations teams may need BPMN symbols, swimlane layouts, or process templates to show tasks, approvals, ownership, and handoffs clearly.
These assets help teams create diagrams in the language of their work. If you're mapping a cloud architecture, the tool should give you the right service icons instead of making you recreate every element manually. If you're building an ER diagram, it should help you show entities, attributes, relationships, and keys clearly. If you're documenting a workflow, BPMN symbols or swimlane layouts can make the process easier to follow.
The more specific your diagramming needs are, the more important these assets become. They help teams create diagrams that are faster to build, easier to read, and closer to the standards people already use in that field.
4. Can your team review and collaborate without losing context?
A diagram becomes more useful when the discussion stays close to the visual. If feedback is scattered across chats, documents, and meetings, teams can lose the reasoning behind decisions.
Imagine an engineering team reviewing a system flow. One person leaves a comment about an API dependency, another asks why a step is missing, and a product manager wants to confirm how the flow affects the user experience. If those conversations happen away from the diagram, the next person opening it may see the final version but not understand why it changed.
Look for collaboration features such as comments, mentions, live editing, guest access, shareable links, and version history. Real-time collaboration like video meetings and live cursors can help when people are building a diagram together. Comments and async review are useful when teammates need time to check details before responding.
Feedback is easier to act on when it stays next to the diagram. It helps the team understand what changed, why it changed, and what needs to happen next.
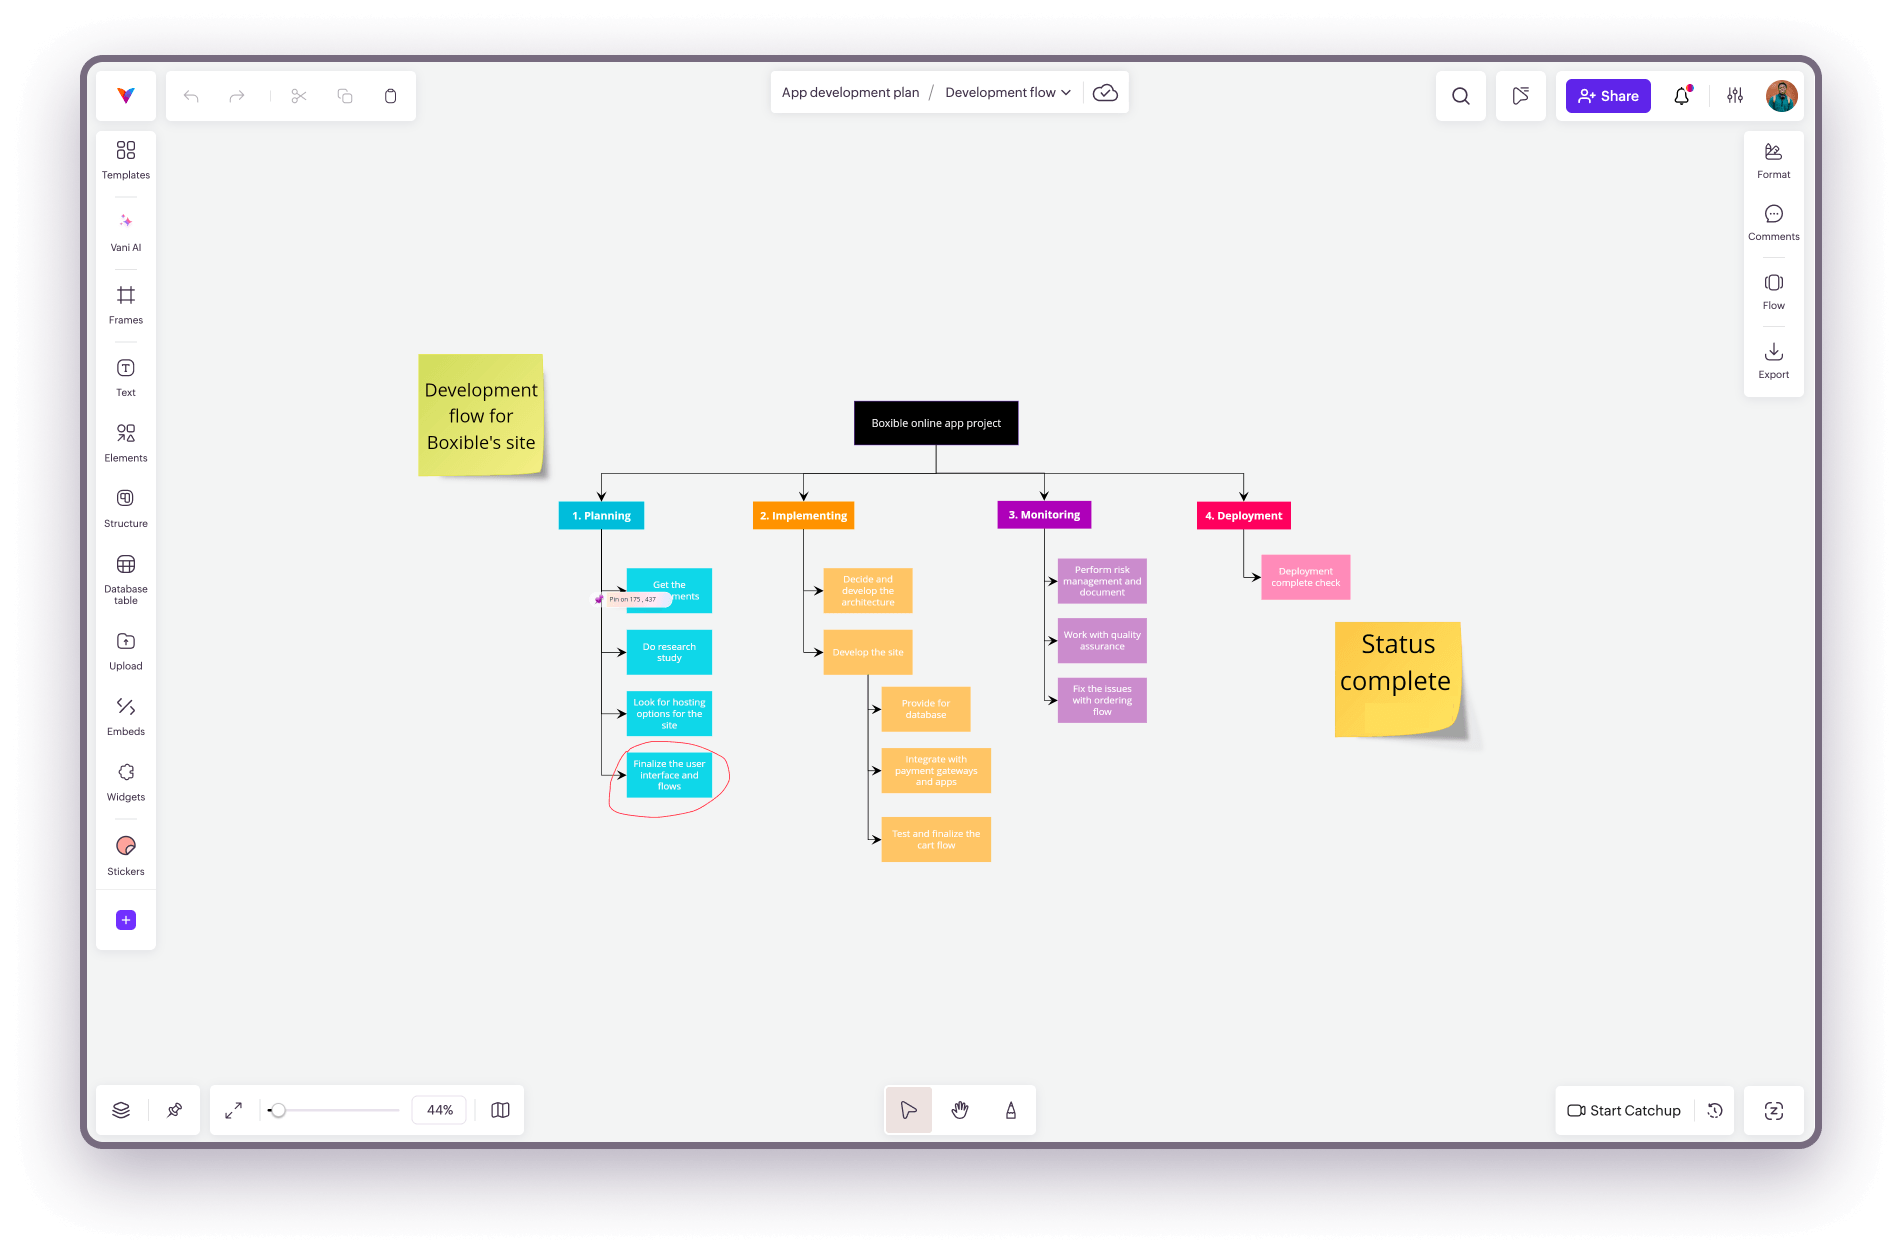
5. Can it handle both simple diagrams and technical detail?
A collaborative diagramming tool should let you start simple and add detail when the work needs it. Teams should not have to switch tools every time a diagram becomes more technical.
For example, a product team may first draw a simple signup flow: choose a plan, create an account, verify email, and invite teammates. That version should be easy for anyone to understand. Later, engineering may need to map what happens behind the same flow, such as APIs, database tables, third-party services, error paths, and security checks. That version needs more structure, clearer connectors, and technical shapes.
Both diagrams are connected to the same work, but they need different levels of detail. The first one helps people understand the user journey. The second one helps technical teams plan and review the system behind it.
So check whether the tool can handle quick diagrams like flowcharts, mind maps, org charts, and process maps as well as structured diagrams like ER diagrams, UML diagrams, BPMN diagrams, data flow diagrams, network diagrams, and cloud architecture diagrams.
Some advanced diagramming tools also support data-linked diagrams or automatic updates from spreadsheets, databases, or other sources. If your team needs that level of automation, check for it early. For many teams, the bigger priority is whether the tool can move from simple explanation to technical detail without making the diagram hard to read.
6. Will your diagrams stay useful as work changes?
A diagram should not become outdated after the first version. It should be easy to find, update, reuse, and trust as the project changes.
For example, a support team may create a troubleshooting flowchart for common customer issues. Six months later, the product changes. If nobody knows where the diagram lives, who owns it, or whether it is still accurate, the team stops trusting it. If updating the diagram takes longer than answering tickets manually, nobody maintains it. Eventually, people may go back to answering the same questions manually because the documentation no longer feels reliable.
This is where experienced teams often struggle. Diagrams get duplicated across tools, old versions keep circulating, and nobody knows which one is the source of truth. Over time, this creates diagram sprawl: too many visuals with too little clarity.
Look for features that help diagrams stay organized over time. This may include proper workspaces, search, clear navigation, version history, reusable templates, ownership, and ways to keep related notes or files close to the diagram.
A good diagramming tool should help diagrams stay clear, findable, and editable as work changes. Otherwise, even a well-made diagram can become another outdated file.
7. Are the AI features actually useful?
AI is useful only when the result gives your team a diagram they can edit, review, and improve. A nice-looking output isn't enough if the structure doesn't make sense.
When evaluating AI diagramming, check whether the tool can generate specific diagram types from a prompt, such as flowcharts, mind maps, or process diagrams. Also check whether the output is easy to edit after it's created.
AI can be helpful when it gives your team a starting point. You might use it to turn a process description into a flowchart or a rough idea into a mind map, but the final diagram still needs human review. Your team has to check whether the steps are accurate, whether the structure is clear, and whether the diagram helps people understand the work better.
The best AI features save time without taking control away from the team.
8. Can you share, export, and control access easily?
A diagram should be easy to share, but access should still be controlled. This matters when diagrams are used in reviews, documentation, client updates, or internal planning.
Check whether the tool supports public and private sharing, guest access, export formats such as PNG or PDF, embeds, and import options. If your team needs diagrams to live inside documents, slides, project tools, or other workspaces, check the available integration and embed options, too.
Access control also matters. The right people should be able to view, comment, or edit while sensitive work stays protected. Look for viewer, commenter, and editor roles; workspace-level permissions; admin controls; and external sharing settings.
Good diagramming software should help diagrams reach the right people without making access difficult to manage.
A quick checklist before choosing an online diagram maker
Before choosing a tool, ask:
- What diagrams do we create most often?
- Do we need both simple and technical diagrams?
- How easy is it to start from scratch or a template?
- Can diagrams be edited easily after the first draft?
- Does the tool have the right templates and shape libraries?
- Can teammates comment, review, and collaborate?
- Will diagrams stay useful as work changes?
- Are the AI features useful for our actual workflow?
- Can we share, export, and embed diagrams where needed?
- Can we control who can view, comment, and edit?
- Will this tool still work as our team or project grows?
How Vani supports diagramming for teams
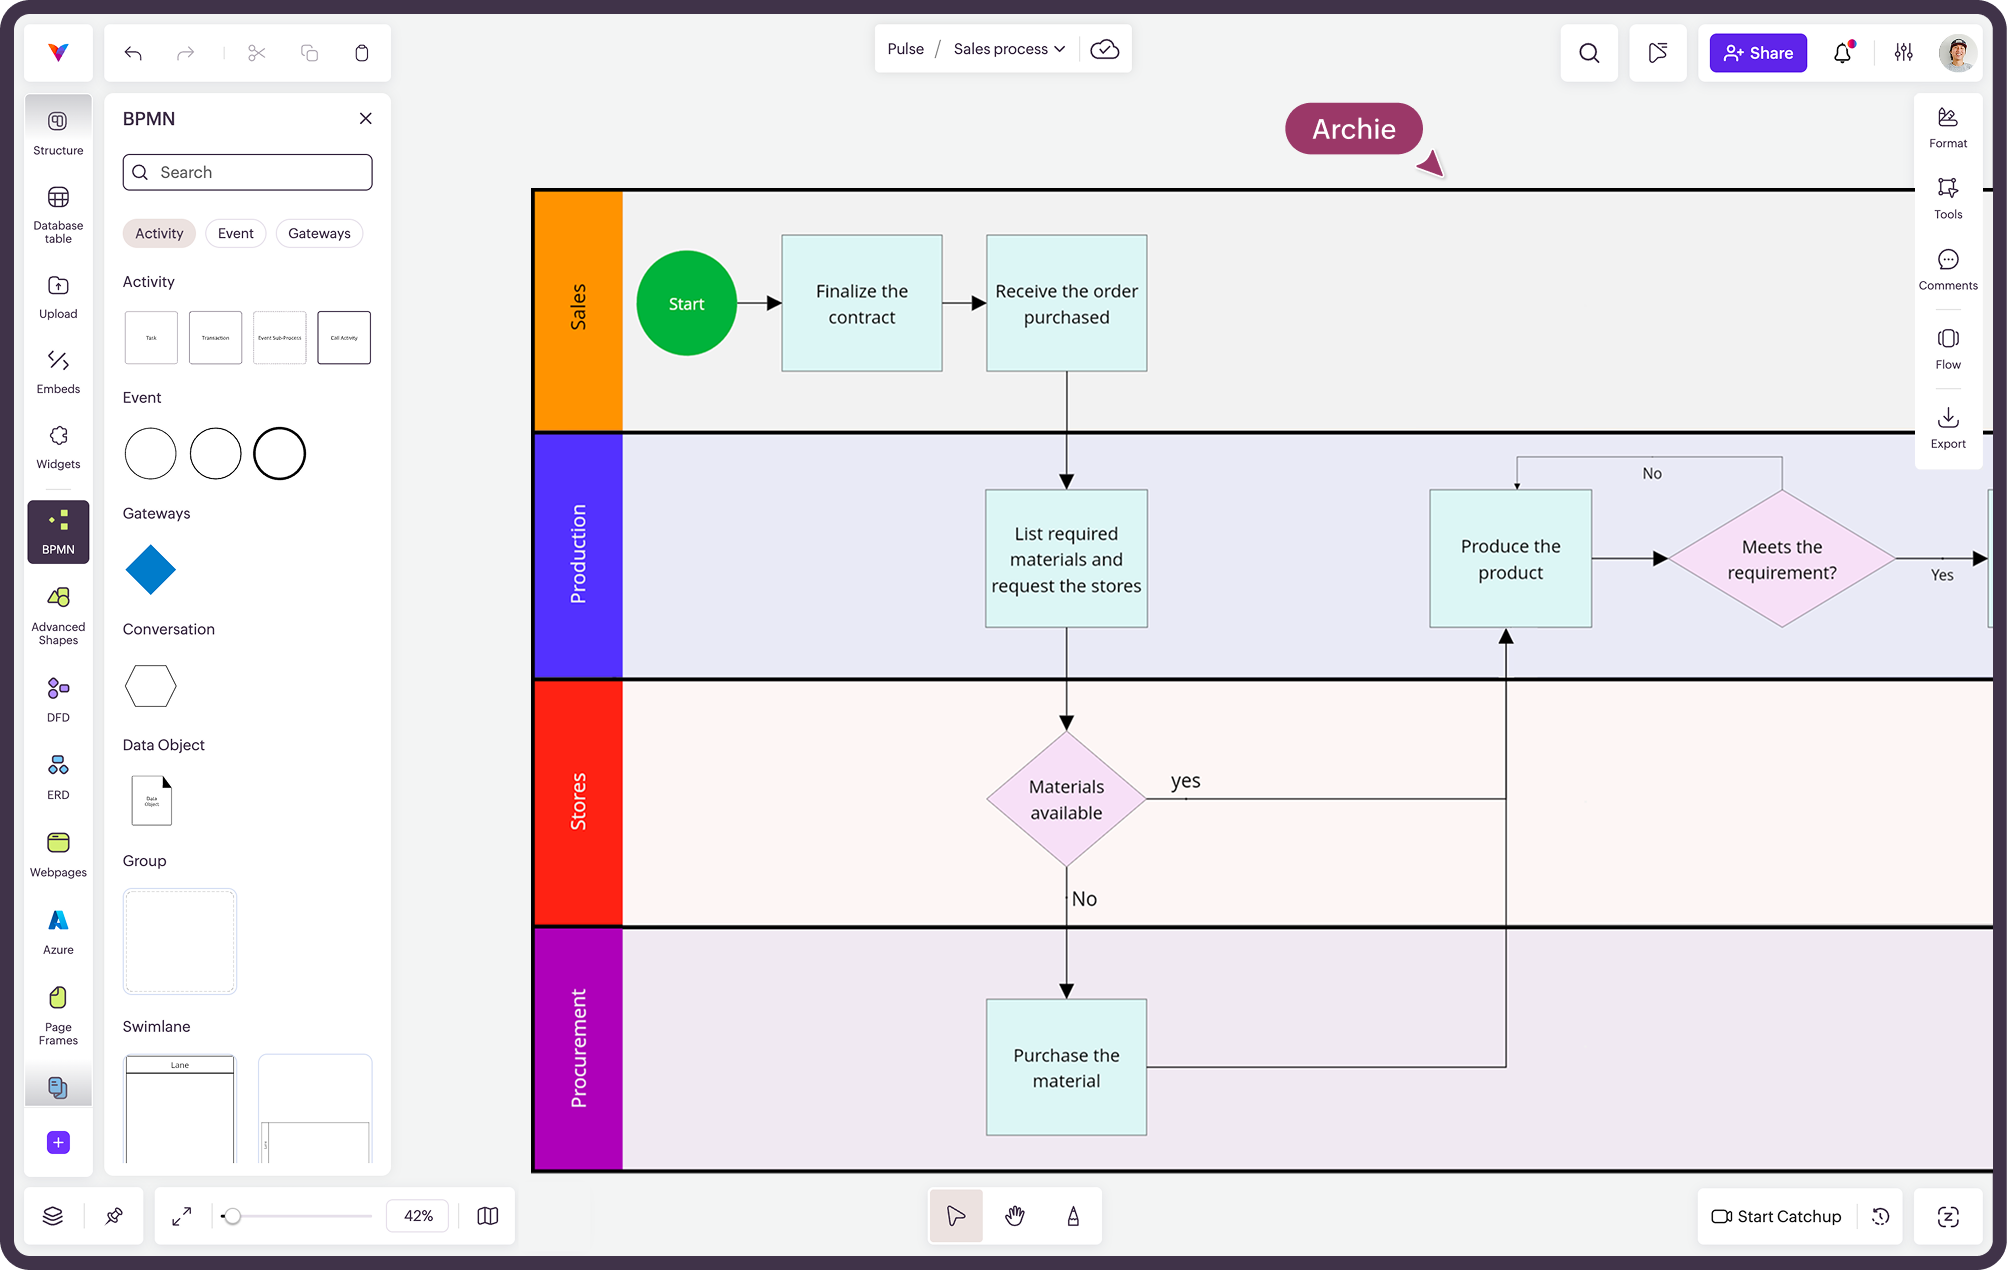
Many diagramming tools help teams create the diagram. Vani is useful when the diagram needs to stay connected to the rest of the work.
In a Vani Space, teams can create flowcharts, mind maps, user flows, process maps, ER diagrams,BPMN diagrams, UML diagrams, cloud architecture diagrams, network diagrams, and other structured visuals. They can also keep related notes, discussions, files, documentation, and planning work close to the diagram instead of spreading context across multiple tools.
Vani supports diagramming with shapes, connectors, templates, Vani AI, and diagramming Kits. For more specific needs, teams can use Kits for areas such as ERD, BPMN, DFD, UML, AWS, Azure, Google Cloud, Kubernetes, and Cisco network diagrams. Vani also supports draw.io and Mermaid as separate diagramming workflows.
The larger advantage is that diagrams live inside the same Space as the work around them. Teams can review diagrams with comments; manage who can view, comment, or edit; export work when needed; and keep related planning, documentation, and discussions close to the diagram. Instead of creating diagrams that get exported and forgotten, teams can keep them connected to everyday project work. As the project evolves, the diagram can evolve with it.
FAQs
What is an online diagram maker?
An online diagram maker is a web-based tool for creating diagrams such as flowcharts, mind maps, process maps, ER diagrams, UML diagrams, architecture diagrams, and org charts. Most online diagram makers also support templates, sharing, collaboration, and cloud access.
What should teams check before choosing an online diagram maker?
Teams should check diagram type support, ease of creation, templates and shape libraries, collaboration, technical diagramming depth, AI features, sharing, exports, access control, and whether diagrams can stay organized as work changes.
What is the best online diagram maker for teams?
The best online diagram maker for teams depends on the diagrams your team creates and how people work together on them. Technical teams may need ERD, UML, BPMN, network, or cloud architecture support. Product and operations teams may need templates, comments, sharing, and collaboration. Marketing and leadership teams may need quick mind maps, flowcharts, or visual planning diagrams.
Is an online whiteboard the same as a diagram maker?
Not always. Online whiteboards are broader spaces for brainstorming, workshops, and visual collaboration. Diagram makers are more focused on structured visuals with shapes, connectors, and templates. Some tools combine both, so teams can brainstorm and create structured diagrams in the same place.
Can AI help create diagrams?
Yes. AI can help create first drafts from prompts or rough ideas. It can be useful for flowcharts, mind maps, and process diagrams. However, teams should still review the diagram for accuracy, structure, and clarity.
How do I choose a diagram maker for technical diagrams?
For technical diagrams, look for support for UML, ER diagrams, BPMN diagrams, network diagrams, cloud architecture icons, data flow diagrams, and precise connectors. Also check whether the diagram can be shared, exported, reviewed, and understood by both technical and non-technical stakeholders.