- HOME
- Technology & Trends
- Flowchart vs. process map: Which should your team use?
Flowchart vs. process map: Which should your team use?
- Last Updated : August 24, 2026
- 43 Views
- 9 Min Read

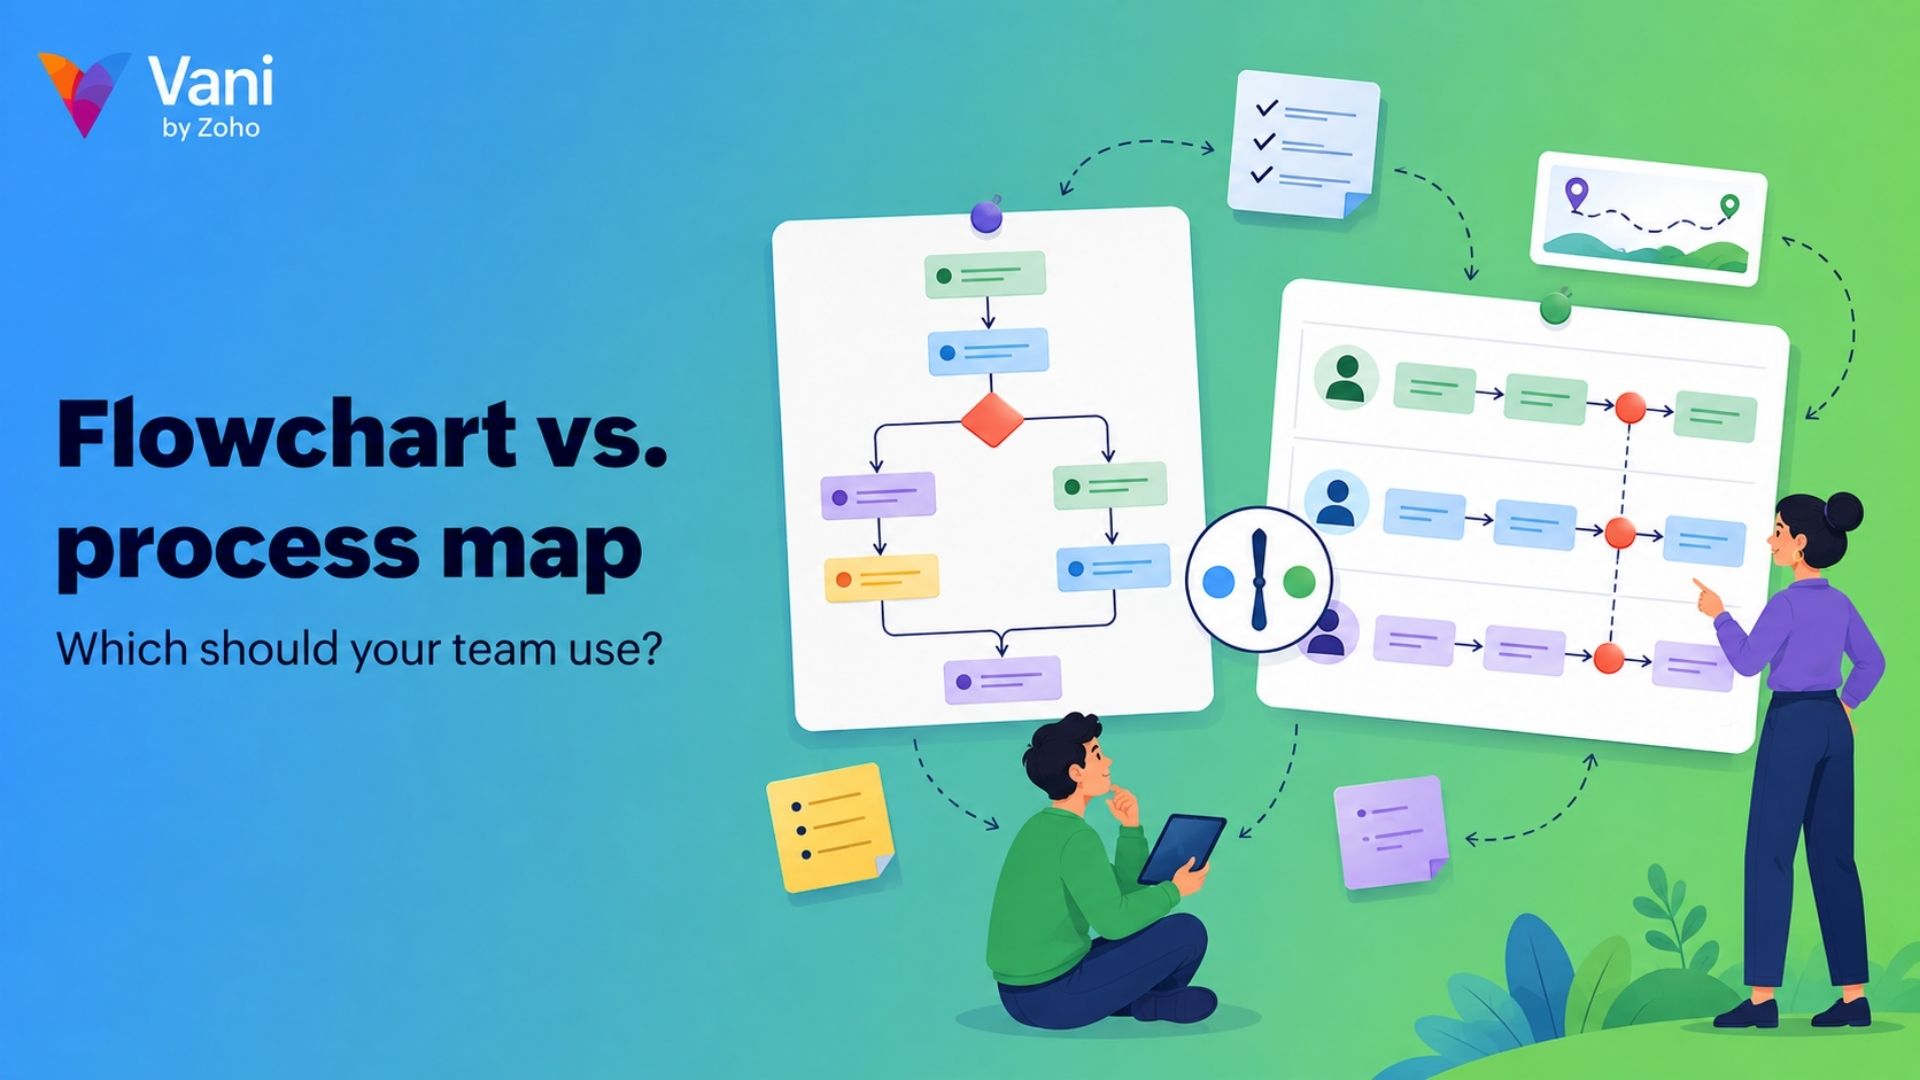
When a process gets complicated, explaining it in words can quickly become confusing. There are too many steps, decisions, people, systems, and possible outcomes to keep track of.
That’s why teams often turn to visual process diagrams. A few boxes, arrows, decisions, and connections can make a complicated workflow much easier to understand.
But that leads to a question: should you use a flowchart or a process map?
The answer is that both the flowchart and the process map provide streamlined functions of workflows, processes, and operations flow. Use a flowchart when you need to explain what happens next, and use a process map to understand how a wider process works. A flowchart is a visual format that concentrates on the sequence of steps, and a process map is a broader method that includes process owners, inputs, outputs, stages, handoffs, delays, controls, or any issues.
However, the distinction is not absolute; it's a very thin line, and that means a flowchart can be used as a process map. The right choice depends less on what the diagram is called and more on what your team needs it to answer.
Let's look at the differences in more detail.
Key highlights
Flowchart vs. process map: Understand the key differences in purpose, scope, functionality, and use cases, and learn when each visual works best.
Flowcharts and process map explained: Explore their different types, what they help you visualize, and when to choose one over the other.
Real-world use cases across teams: See how teams from product and engineering to operations, HR, sales, marketing, and support use flowcharts and process maps to visualize their work.
How to create flowcharts and process maps in Vani: Learn how to visualize processes, bring cross-functional teams together, review workflows, and turn complex processes into actionable visuals.
Flowchart vs. process map at a glance
Factor | Flowchart | Process map |
Primary question | What happens next? | How does the complete process work? |
Main purpose | Explain a sequence or decision path | Document, analyze, and improve work |
Typical scope | A focused activity or logic path | A process from trigger to outcome |
Information shown | Steps, decisions, and direction | Steps, roles, inputs, outputs, handoffs, and sometimes metrics |
Best audience | People learning or following a defined path | Process owners and cross-functional stakeholders |
Common uses | Instructions, decision logic, troubleshooting, and system behavior | Standardization, onboarding, compliance, process improvement, and automation planning |
Common formats | Basic, decision, system, and data flowcharts | High-level, detailed, swimlane, SIPOC, and value-stream maps |
What is a flowchart?
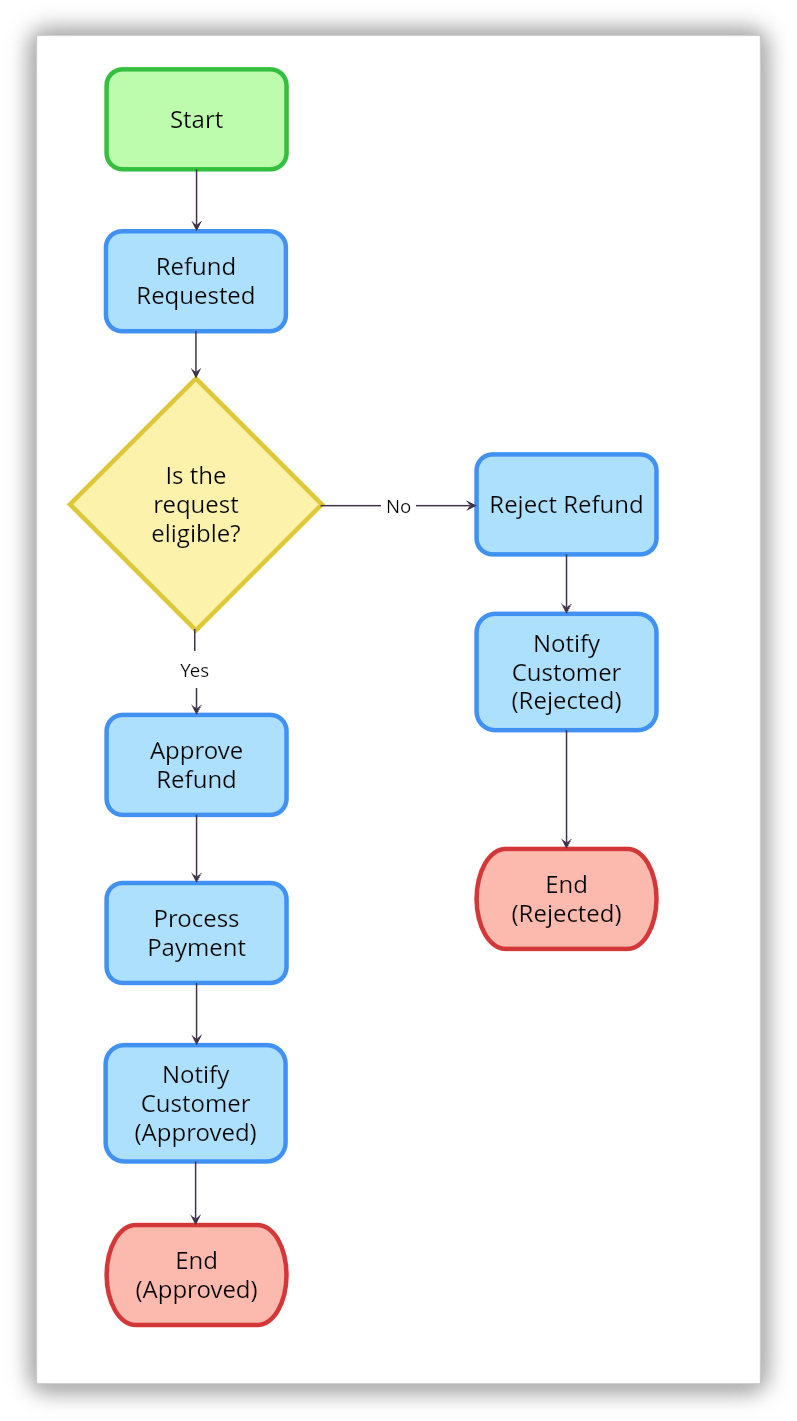
A flowchart is a visual diagram that uses shapes to show the sequence of steps, actions, or decisions in an order.
Think of it as a visual set of instructions: You start at one point, follow the arrows, make decisions along the way, and eventually reach an outcome.
For example, imagine a customer requesting a refund:
What are the common types of flowcharts?
Flowcharts can take different forms depending on the process you're explaining. Common types include:
Basic flowchart
Swimlane flowchart
Decision tree flowchart
Data flow diagram flowchart
Workflow diagram
UML activity diagram
BPMN flowchart
You can learn more about the different types of flowcharts.
Most basic flowcharts use a familiar set of symbols:
An oval for the start or end
A rectangle for an action or process step
A diamond for a decision
A parallelogram for an input or output
Arrows to show the direction of flow
When should you use a flowchart?
A flowchart works well when your team needs to:
Explain a sequence quickly
Document decision logic
Create a troubleshooting guide
Show how a system or algorithm behaves
Teach someone how to follow a procedure
Explore alternate paths or outcomes
The strength of a flowchart lies in its clarity; someone can easily understand a flowchart from start to end without the need for extensive technical background knowledge.
The simplicity of a flowchart can also be a limitation; it doesn't reveal who owns each step, what information enters the process, how long a handoff takes, or where work repeatedly gets delayed. When those questions arise, the team usually needs a process map.
What is a process map?
A process map is a visual representation of how work moves from a defined trigger to a result. It can include the sequence of activities, but it often adds the context surrounding those activities: people, teams, systems, inputs, outputs, handoffs, exceptions, controls, or measurements.
Process maps therefore help teams see not only what should happen but how work actually happens across an organization.
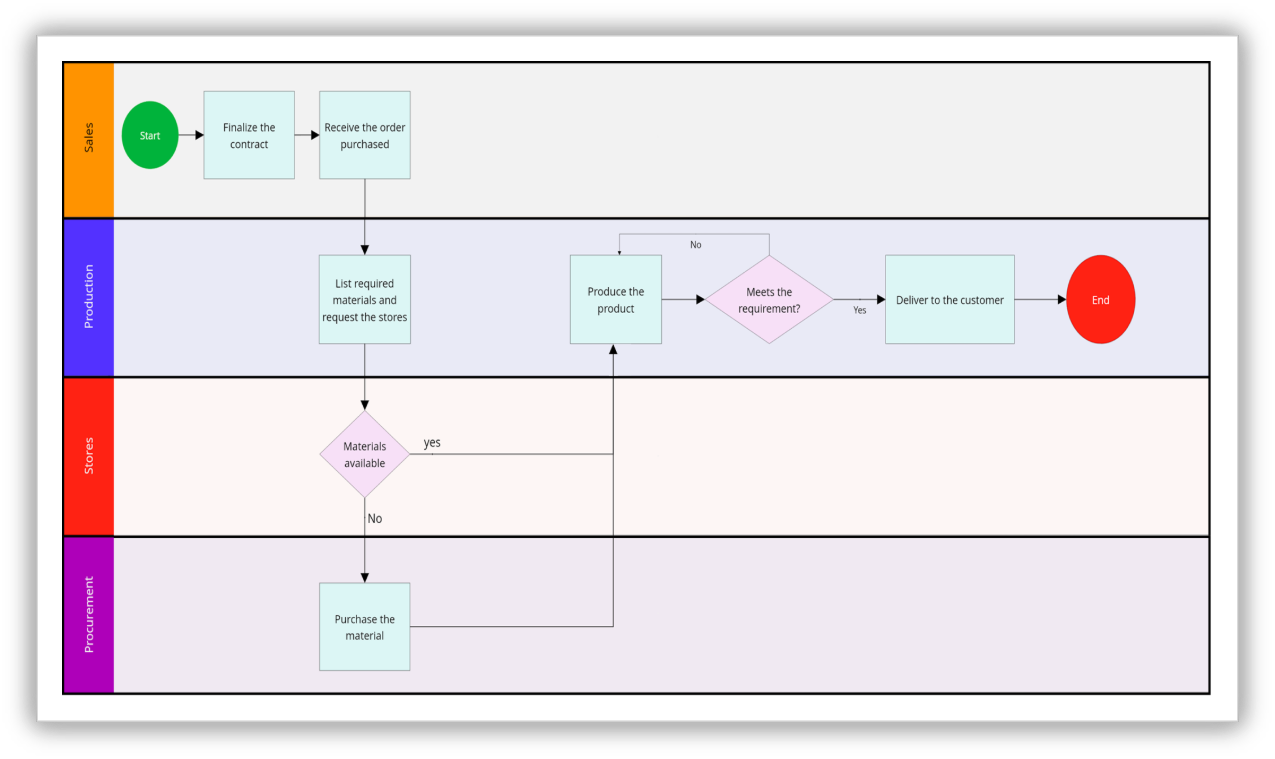
For example, a flowchart might show only the flow of a sales cycle, but a process map could show which team receives the request, which team packs the material, and which team fulfills the order.
What are the common types of process maps?
There isn't one format that works for every process. Common types include:
High-level process map: Shows the major stages without operational detail
Swimlane process map: Groups activities by person, team, or system to make ownership and handoffs visible
SIPOC diagram: Summarizes suppliers, inputs, process, outputs, and customers
Value-stream map: Examines the flow of value and identifies waiting time or waste
Customer journey map: Shows the customer’s experience across stages, touchpoints, emotions, and pain points
When should one use a process map?
Create a process map when your team needs to:
Understand a process from beginning to end
Clarify ownership across teams
Find bottlenecks, duplication, or unnecessary handoffs
Standardize how work is performed
Prepare a process for automation
Support training, audits, or compliance
Compare the current process with a proposed future process
What is the difference between a flowchart and a process map?
1. The question being answered
A flowchart usually answers, “What happens next?” A process map asks broader questions: “Who performs this step?” “What enters and leaves the process?” “Where are the delays?” “What needs to improve?”
2. The process boundary
A flowchart can focus on a small piece of logic, such as deciding whether to approve a refund. A process map is more likely to cover the journey from the refund request through review, payment, customer notification, and reporting.
3. The type of detail
Flowchart detail usually describes actions and decisions. Process-map detail describes the operating context around them. However, a process map is not automatically more complex: a high-level process map can be simpler than a technical flowchart with dozens of branches.
4. Ownership and handoffs
Basic flowcharts may leave ownership implicit. Process maps—especially swimlane maps—make it clear when work moves between people, departments, or systems. These handoffs are often where delays and misunderstandings arise.
5. Communication vs. analysis
Flowcharts are particularly effective communication tools. Process maps can communicate too, but they are frequently built for analysis: understanding the present state, finding friction, and designing a better future state.
6. The intended audience
A flowchart may be designed for a specific role, such as a support agent following a troubleshooting path. A process map often brings together several audiences, including frontline employees, team leads, process owners, and stakeholders from connected departments.
7. How the visual is maintained
A flowchart should change when the underlying logic changes. A process map may also require updates when ownership, tools, policies, controls, or service-level expectations change. Assigning an owner prevents either visual from becoming outdated documentation.
Flowchart vs. process map: How do teams use them?
The same distinction becomes easier to understand when applied to everyday team scenarios.
Team | Flowchart use case | Process map use case |
Product | Model feature logic or an in-product decision path | Map the journey from customer feedback to release |
Engineering | Describe an algorithm, API response, or incident decision tree | Examine deployment, change-management, or incident-response processes |
UX and design | Show screen navigation and alternate user paths | Map an end-to-end customer or service experience |
Operations | Document approval logic or a standard procedure | Find bottlenecks, handoffs, and capacity issues |
HR | Show candidate-screening or leave-approval decisions | Map recruiting, onboarding, or offboarding across teams |
Sales | Visualize lead qualification and routing | Map the lead-to-revenue process across Sales, Legal, and Finance |
Marketing | Define nurture branches or campaign decision rules | Map work from campaign brief to launch and reporting |
Customer support | Create a troubleshooting or escalation tree | Analyze the complete ticket lifecycle, ownership, and SLA performance |
Finance | Explain expense-approval decisions | Map procure-to-pay or order-to-cash processes |
Compliance | Show control logic and exception paths | Document owners, evidence, controls, and audit handoffs |
The pattern is fairly consistent. When the team needs to explain logic or sequence, a flowchart is usually the natural choice. When the team needs to understand ownership, handoffs, dependencies, or improvement opportunities, a process map becomes more useful.
Flowchart vs. process map example: Customer support
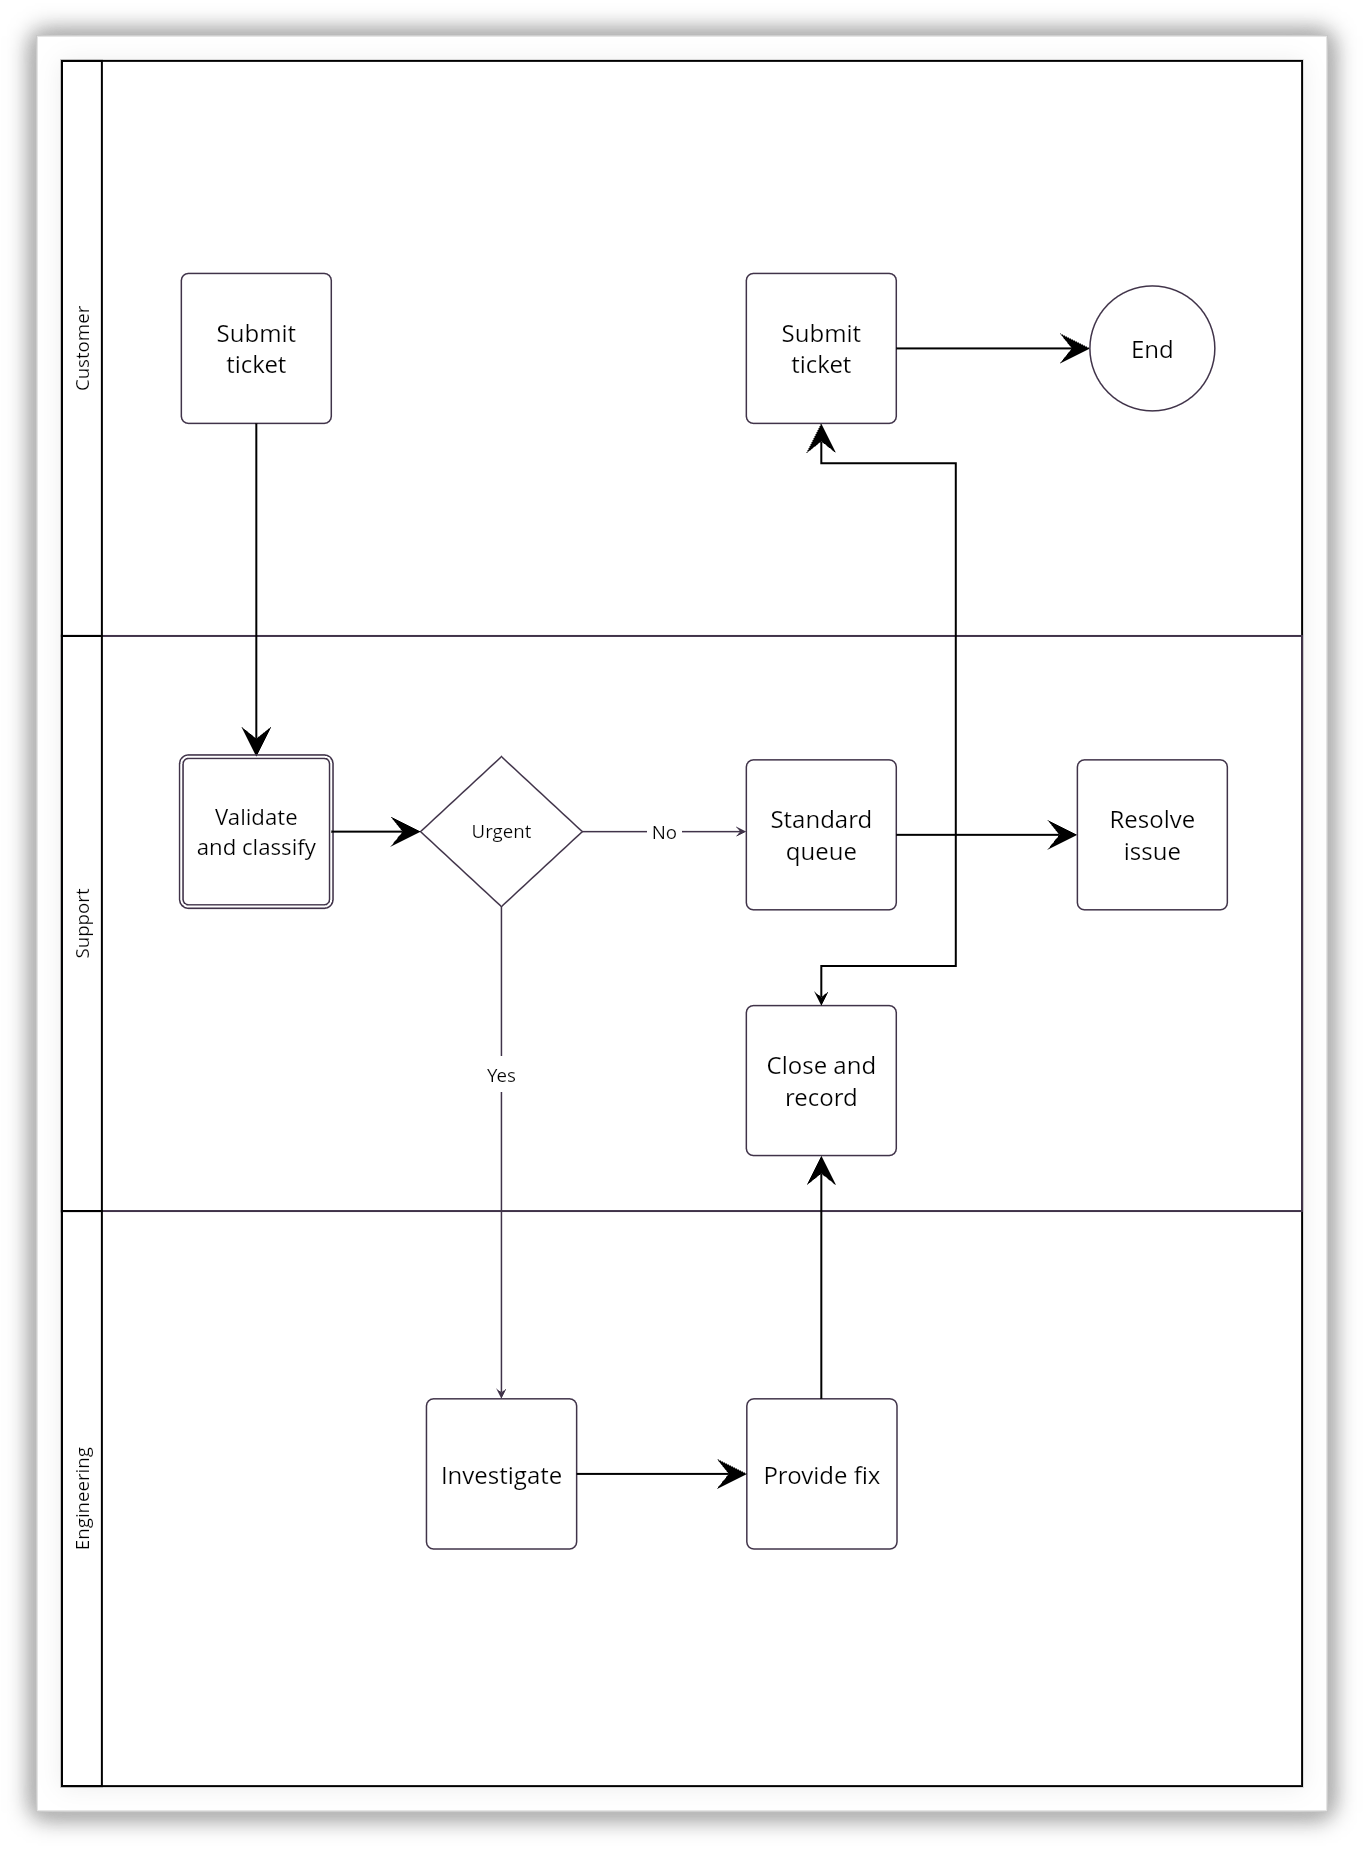
Let's make the difference more concrete. Say you're mapping how a customer support ticket gets resolved.
As a flowchart, it looks like: Ticket received → Is it urgent? → Yes: escalate. No: assign to queue → Agent responds → Resolved? → Yes: close ticket. No: loop back to agent.
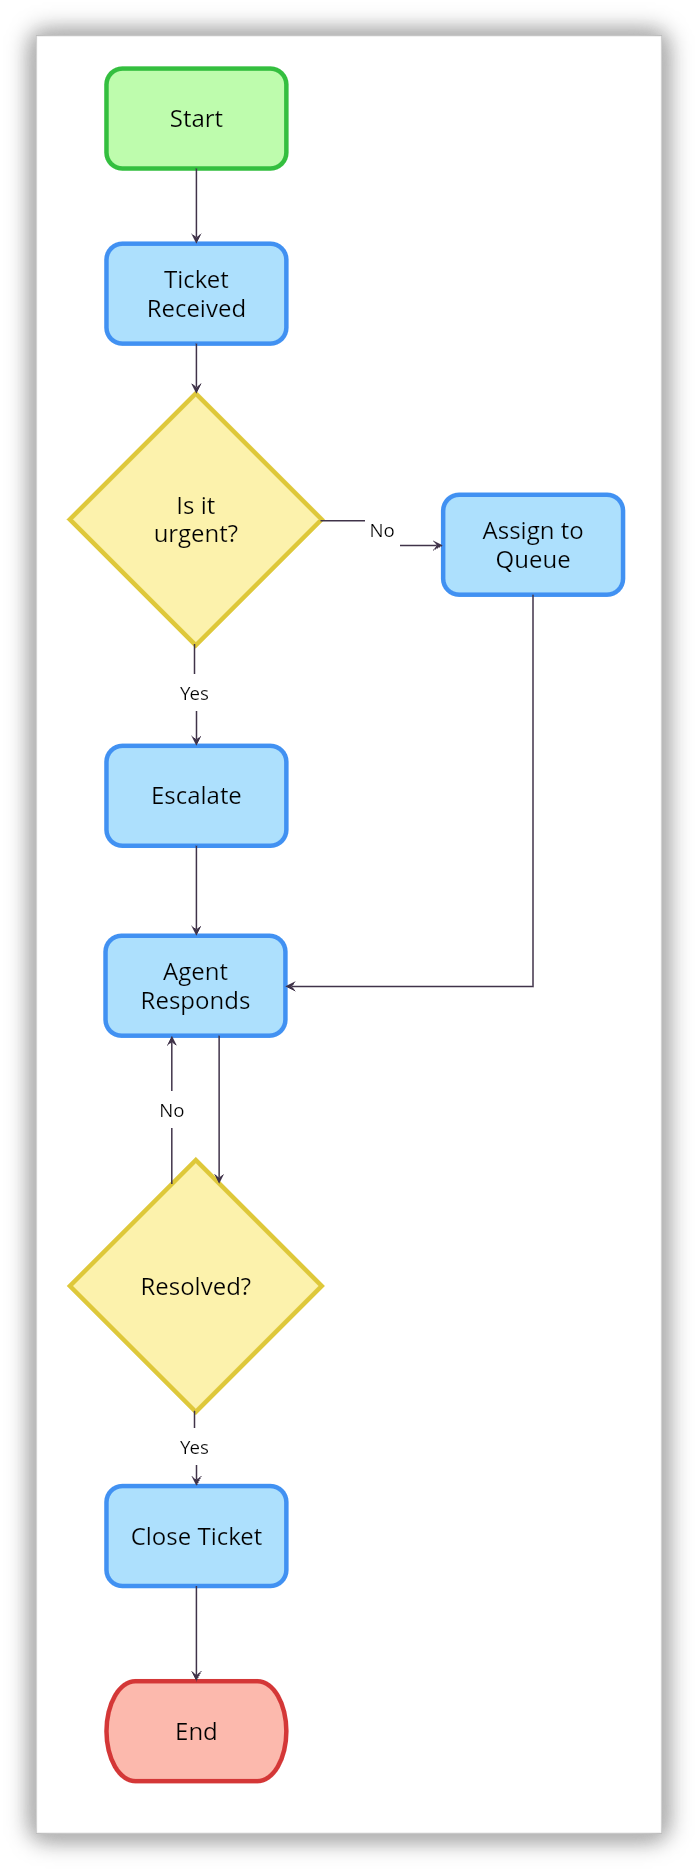
That's useful, but it doesn't tell you who triggers urgency, which tool the ticket lives in, or where it moves from support to engineering if it's a bug.
As a process map, you'd add swimlanes for Support, Customer, and Engineering. Now you can see the ticket physically moving across lanes, which system it sits in at each stage, and exactly where the handoff friction lives, which is usually the part worth fixing first.
How to choose between a flowchart and a process map
If you're still unsure, start with the question you're trying to answer.
Need to show what happens next? Start with a flowchart.
Need to understand who does what? Use a swimlane process map.
Need to explain decision logic? Use a decision flowchart.
Need to identify delays or waste? Create a detailed process or value-stream map.
Need a simple view for leadership? Use a high-level process map.
Need to document an SOP? Use a flowchart for the instructions and a process map for the larger operating context.
Need to prepare a process for automation? Map the current process first, improve it, and then define detailed workflows and exceptions.
Teams don't always have to choose one. A process map can reveal the complete system, while smaller flowcharts extracted from it can guide particular roles or decisions.
You can also use both flowcharts and process maps when you work on different stages of development, and, for that, Vani is a perfect tool to visualize both diagrams.
How to create a flowchart or process map in Vani
Once you've decided what you need to visualize, the next step is bringing the people who understand the process together. With Vani, teams can create flowcharts and process maps on an infinite canvas, collaborate in real time, review the process together, and keep improving it as the way they work changes.
1. Start with a shared canvas
Create a blank canvas in Vani, name your Space and Zone, and bring the relevant stakeholders into the Vani Space.
If you are new to Vani and need support to get started, read this help article.
2. Define the objective
Before drawing anything, brainstorm with your team to address questions like: What's the purpose of this workflow? What process are we mapping? Who will use it? What must it answer?
3. Build the flow
Use Vani's infinite canvas to draw the process from start to end using the advanced shapes.
For a flowchart, focus on sequence, decisions, and alternate paths.
For a process map, add the surrounding context: owners, systems, inputs, outputs, handoffs, and other information that helps explain how work actually moves.
You can also use Vani AI to help generate a flowchart and get the first version on the canvas faster.
4. Start with a template or Kit
You don't have to create everything from scratch. Vani provides diagramming Kits and templates to help teams get started:
Kits:
Templates:
5. Add the right context
Include decisions for a flowchart. Add owners, handoffs, inputs, outputs, or performance notes for a process map.
The goal isn't to add as much information as possible; it's to add the right information for the question you're trying to answer.
6. Review it with the people doing the work
Bring relevant stakeholders into the canvas, review the process together, and use contextual comments to question assumptions, verify steps, and surface exceptions. This is often where teams discover the difference between what should happen and what actually happens.
7. Present the process step by step
Use Vani's Flow mode to walk stakeholders through the process step by step, allowing everyone to focus on one section at a time.
8. Assign an owner
Assign someone to maintain the diagram so it stays useful as the process evolves.
9. Share and document the final version
Once the process has been reviewed and agreed upon, share it with the relevant stakeholders or document it for future reference. You can export the visual in PNG or PDF format or share it through a link.
Start with the question, not the diagram name
The difference between a flowchart and a process map is ultimately a difference in intent. A flowchart helps people follow a sequence. A process map helps teams understand the system around that sequence.
If your question is what happens next, start with a flowchart. If it's how something works across your team and how you can improve it, create a process map. When you need both views, build the shared process first and turn its individual decisions into focused flowcharts.
With Vani, your team can bring these views together in one visual workspace where you can create, collaborate, review, present, and continuously improve the way work gets done.